Introduction
As solid-state drives (SSDs) become more affordable, cloud providers are working to provide high-performance, highly reliable SSD-based storage for their customers. As one of the most open source scale-out storage solutions, Ceph faces increasing demand from customers who wish to use SSDs with Ceph to build high-performance storage solutions for their clouds.
The disruptive Intel® Optane™ Solid State Drive based on 3D XPoint™ technology fills the performance gap between DRAM and NAND-based SSDs. At the same time, Intel® 3D NAND TLC is reducing the cost gap between SSDs and traditional spindle hard drives, making all-flash storage an affordable option.
This article presents three Ceph all-flash storage system reference designs, and provides Ceph performance test results on the first Intel Optane and P4500 TLC NAND based all-flash cluster. This cluster delivers multi-million IOPS with extremely low latency as well as increased storage density with competitive dollar-per-gigabyte costs. Click on the link above for a Ceph configuration file with Ceph BlueStore tuning and optimization guidelines, including tuning for rocksdb to mitigate the impact of compaction.
What Motivates Red Hat Ceph* Storage All-Flash Array Development
Several motivations are driving the development of Ceph-based all-flash storage systems. Cloud storage providers (CSPs) are struggling to deliver performance at increasingly massive scale. A common scenario is to build an Amazon EBS-like service for an OpenStack*-based public/private cloud, leading many CSPs to adopt Ceph-based all-flash storage systems. Meanwhile, there is strong demand to run enterprise applications in the cloud. For example, customers are adapting OLTP workloads to run on Ceph when they migrate from traditional enterprise storage solutions. In addition to the major goal of leveraging the multi-purpose Ceph all-flash storage cluster to reduce TCO, performance is an important factor for these OLTP workloads. Moreover, with the steadily declining price of SSDs and efficiency-boosting technologies like deduplication and compression, an all-flash array is becoming increasingly acceptable.
Intel® Optane™ and 3D NAND Technology
Intel Optane technology provides an unparalleled combination of high throughput, low latency, high quality of service, and high endurance. It is a unique combination of 3D XPoint™ Memory Media, Intel Memory and Storage Controllers, Intel Interconnect IP and Intel® software1. Together these building blocks deliver a revolutionary leap forward in decreasing latency and accelerating systems for workloads demanding large capacity and fast storage.
Intel 3D NAND technology improves regular two-dimensional storage by stacking storage cells to increase capacity through higher density and lower cost per gigabyte, and offers the reliability, speed, and performance expected of solid-state memory3. It offers a cost-effective replacement for traditional hard-disk drives (HDDs) to help customers accelerate user experiences, improve the performance of apps and services across segments, and reduce IT costs.
Intel Ceph Storage Reference Architectures
Based on different usage cases and application characteristics, Intel has proposed three reference architectures (RAs) for Ceph-based all-flash arrays.
Standard configuration
Standard configuration is ideally suited for throughput optimized workloads that need high-capacity storage with good performance. We recommend using NVMe*/PCIe* SSD for journal and caching to achieve the best performance while balancing the cost. Table 1 describes the RA using 1x Intel® SSD DC P4600 Series as a journal or BlueStore* rocksdb write-ahead log (WAL) device, 12x up to 4 TB HDD for data, an Intel® Xeon® processor, and an Intel® Network Interface Card.
Example: 1x 1.6 TB Intel SSD DC P4600 as a journal, Intel® Cache Acceleration Software, 12 HDDs, Intel® Xeon® processor E5-2650 v4 .
Table 1. Standard configuration.
|
Ceph Storage Node configuration – Standard |
|
|---|---|
| CPU | Intel® Xeon® processor E5-2650 v4 |
| Memory | 64 GB |
| NIC | Single 10Gb E, Intel® 82599 10 Gigabit Ethernet Controller or Intel® Ethernet Controller X550 |
| Storage | Data: 12 x 4 TB HDD Journal or WAL: 1x Intel® SSD DC P4600 1.6 TB Caching: P4600 |
| Caching Software | Intel® Cache Acceleration Software 3.0, option: Intel® Rapid Storage Technology enterprise/MD4.3; open source cache-like bcache/flashcache |
TCO-Optimized Configuration
This configuration provides the best possible performance for workloads that need higher performance, especially for throughput, IOPS, and SLAs with medium storage capacity requirements, leveraging a mixed of NVMe and SATA SSDs.
Table 2. TCO-optimized configuration
|
Ceph Storage node –TCO Optimized |
|
|---|---|
| CPU | Intel® Xeon® processor E5-2690 v4 |
| Memory | 128 GB |
| NIC |
Dual 10GbE (20 GB), Intel® 82599 10 Gigabit Ethernet Controller |
| Storage | Data: 4x Intel® SSD DC P4500 4, 8, or 16 TB or Intel DC SATA SSDs Journal or WAL: 1x Intel® SSD DC P4600 Series 1.6 TB |
IOPS-Optimized Configuration
The IOPS-optimized configuration provided best performance (throughput and latency) with Intel Optane Solid State Drives as Journal (FileStore) and WAL device (BlueStore) for a standalone Ceph cluster.
- All NVMe/PCIe SSD Ceph system
- Intel Optane Solid State Drive for FileStore Journal or BlueStore WAL
- NVMe/PCIe SSD data, Intel Xeon processor, Intel® NICs
- Example: 4x Intel SSD P4500 4, 8, or 16 TB for data, 1x Intel® Optane™ SSD DC P4800X 375 GB as journal (or WAL and database), Intel Xeon processor, Intel® NICs.
Table 3. IOPS optimized configuration
|
Ceph* Storage node –IOPS optimized |
|
|---|---|
| CPU | Intel® Xeon® processor E5-2699 v4 |
| Memory | >= 128 GB |
| NIC |
2x 40GbE (80 Gb), 4x Dual 10GbE (800 Gb), Intel® Ethernet Converged Network Adapter X710 family |
| Storage | Data: 4x Intel® SSD DC P4500 4, 8, or 16 TB Journal or WAL : 1x Intel Optane SSD DC P4800X 375 GB |
Notes
- Journal: Ceph supports multiple storage back-end. The most popular one is FileStore, based on a filesystem (for example, XFS*) to store its data. In FileStore, Ceph OSDs use a journal for speed and consistency. Using SSD as a journal device will significantly improve Ceph cluster performance.
- WAL: BlueStore is a new storage back-end designed to replace FileStore in the near future. It overcomes several limitations of XFS and POSIX* that exist in FileStore. BlueStore consumes raw partitions directly to store the data, but the metadata comes with an OSD, which will be stored in Rocksdb. Rocksdb uses a write-ahead log to ensure data consistency.
- The RA is not a fixed configuration. We will continue to refresh it with latest Intel® products.
Ceph All-Flash Array performance
This section presents a performance evaluation of the IOPS-optimized configuration based on Ceph BlueStore.
System configuration
The test system described in Table 4 consisted of five Ceph storage servers, each fitted with two Intel® Xeon® processors E5-2699 v4 CPUs and 128 GB memory, plus 1x Intel® SSD DC P3700 2TB as a BlueStore WAL device, and 4x TB Intel® SSD DC P3520 2TB as a data drive. 1x Intel® Ethernet Converged Network Adapters X710 NIC 40 Gb NIC, two ports bonding together through bonding mode 6, used as separate cluster and public networks for Ceph, make up the system topology described in Figure 1. The test system also consisted of 5 client nodes, each fitted with two Intel Xeon processors E5-2699 v4, 64 GB memory, and 1x Intel Ethernet Converged Network Adapters X710 NIC 40 Gb NIC, two ports bonding together through bonding mode 6.
Ceph 12.0.0 (Luminous dev) was used, and each Intel SSD DC P3520 Series runs 4 OSD daemons. The rbd pool used for the testing was configured with 2 replica.
Table 4. System configuration.
|
Ceph Storage node – IOPS optimized |
|
|---|---|
| CPU | Intel® Xeon® processor E5-2699 v4 2.20 GHz |
| Memory | 128 GB |
| NIC | 1x 40 G Intel® Ethernet Converged Network Adapters X710, two ports bonding mode 6 |
| Disks |
1x Intel® SSD DC P3700 (2T) + 4x Intel® SSD DC P3520 2 TB |
| Software configuration |
Ubuntu* 14.04, Ceph 12.0.0 |
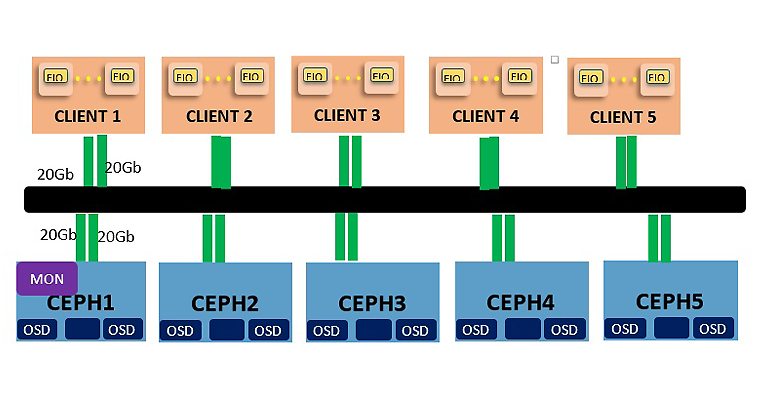
Figure 1. Cluster topology.
Testing methodology
To simulate a typical usage scenario, four test patterns were selected using fio with librbd. It consisted of 4K random read and write, and 64K sequential read and write. For each pattern, the throughput (IOPS or bandwidth) was measured as performance metrics with the number of volumes scaling; the volume size was 30 GB. To get stable performance, the volumes were pre-allocated to bypass the performance impact of thin-provisioning. OSD page cache was dropped before each run to eliminate page cache impact. For each test case, fio was configured with a 100 seconds warm up and 300 seconds data collection. Detailed fio testing parameters are included as part of the software configuration.
Performance overview
Table 5 shows a promising performance after tuning on this five-node cluster. 64K sequential read and write throughput is 5630 MB/s and 4200 MB/s respectively (maximums with the Intel Ethernet Converged Network Adapters X710 NIC in bonding mode 6). 4K random read throughput is 1312K IOPS with 1ms average latency, while 4 KB random write throughput is 331K IOPS with 4.8 ms average latency. The performance measured in the testing was roughly within expectations, except for a regression of 64K sequential write tests compared with previous Ceph releases, which requires further investigation and optimization.
Table 5. Performance overview.
|
Pattern |
Throughput |
Average Latency |
|---|---|---|
| 64KB Sequential Write | 4200 MB/s | 18.9ms |
| 64KB Sequential Read | 5630 MB/s | 17.7ms |
| 4KB Random Write | 331K IOPS | 4.8ms |
| 4KB Random Read | 1312K IOPS | 1.2ms |
Scalability tests
Figures 2 to 5 show the graph of throughput for 4K random and 64K sequential workloads with different number of volumes, where each fio was running in the volume with a queue depth of 16.
Ceph demonstrated excellent 4K random read performance on the all-flash array reference architecture, as the total number of volumes increased from 1 to 100, the total 4K random read IOPS peaked around 1310 K IOPS, with an average latency around 1.2 ms. The total 4K random write IOPS peaked around 330K IOPS, with an average latency around 4.8 ms.
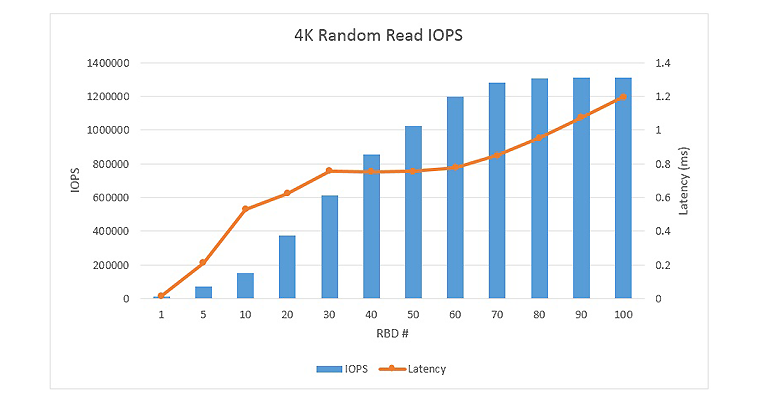
Figure 2. 4K Random read performance.
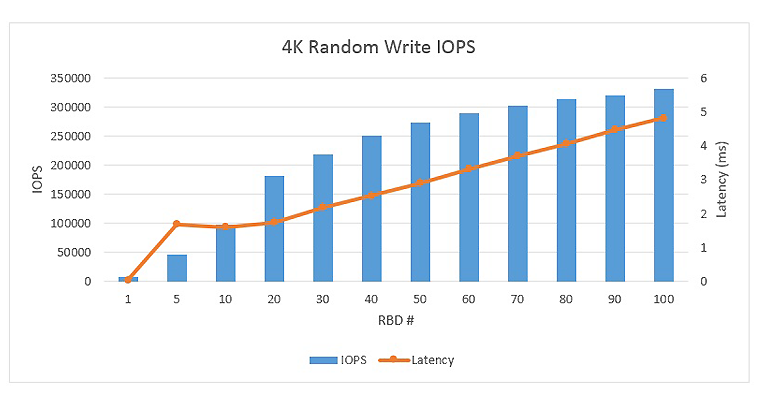
Figure 3. 4K random write performance load line.
For 64K sequential read and write, as the total number of volumes increased from 1 to 100, the sequential read throughput peaked around 5630 MB/s, while sequential write peaked around 4200 MB/s. The sequential write throughput was lower than the previous Ceph release (11.0.2). It requires further investigation and optimization; stay tuned for further updates.
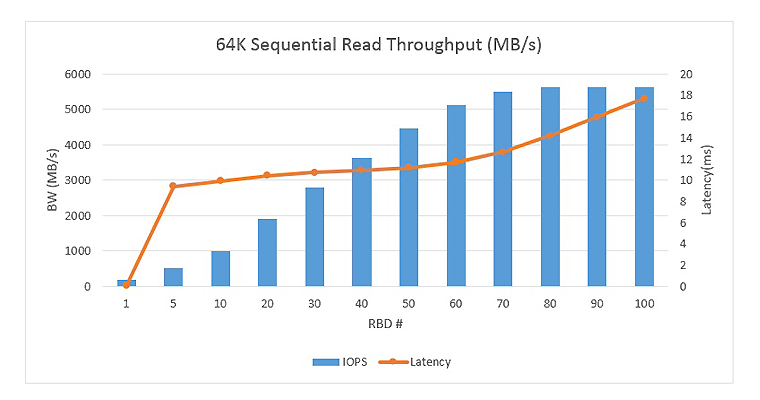
Figure 4. 64K sequential read throughput
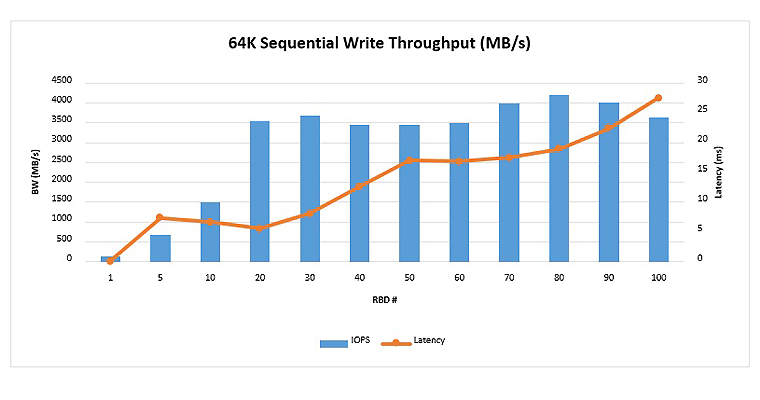
Figure 5. 64K sequential write throughput
Latency Improvement with Intel® Optane™SSD
Fig 6 shows the latency comparison for 4K random write workloads with 1x Intel® SSD DC P3700 series 2.0 TB and 1x Intel Optane SSD DC P4800X series 375 GB drive as rocksdb & WAL device. The results proved with the Intel Optane SSD DC P4800X series 375 GB SSD as rocksdb and WAL drive in Ceph BlueData, the latency was significantly reduced: a 226% reduction in 99.99% latency.
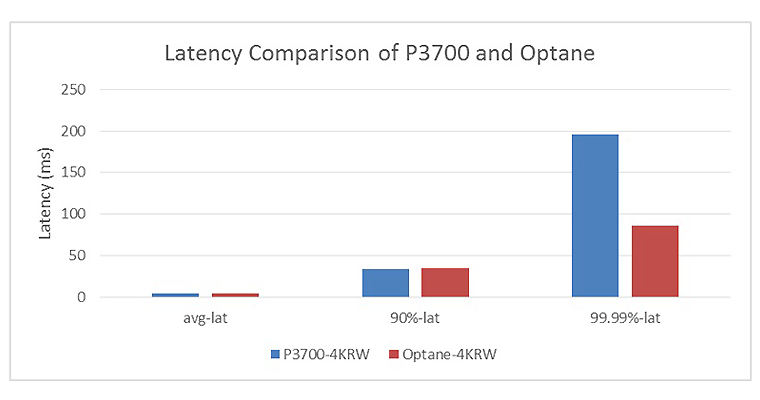
Figure 6. 4K random read and 4K random write latency comparison
Summary
Ceph is one of most open source scale-out storage solutions, and there is growing interest among Cloud providers in building Ceph-based high-performance all-flash array storage solutions. We proposed three different reference architecture configurations targeting for different usage scenarios. The results for testing that simulated different workload pattern demonstrated that a Ceph all-flash system could deliver very high performance with excellent latency.
Software configuration
Fio configuration used for the testing
Take 4K random read for example.
[global]
    direct=1
    time_based
[fiorbd-randread-4k-qd16-30g-100-300-rbd]
    rw=randread
    bs=4k
    iodepth=16
    ramp_time=100
    runtime=300
    ioengine=rbd
    clientname=${RBDNAME}
    pool=${POOLNAME}
    rbdname=${RBDNAME}
    iodepth_batch_submit=1
    iodepth_batch_complete=1
    norandommap
This sample source code is released under the Intel Sample Source Code License Agreement.