Intel® VTune™ Profiler is a fantastic tool for getting all kinds of information on your application’s performance. In some cases that information may be too much, and create a large result set that can cause VTune to perform slowly. This article discusses ways to reduce the result size while still getting the information you need to find and fix your performance issues.
Analysis Configuration
What?
The first place to start is the What pane in the new analysis window, under the Advanced options. If you prefer to use the command-line, you can generate the command after configuring the options in the GUI.

Going from the top to the bottom, there are seven options that control the collection size:
- Managed code profiling mode
- If your application uses a mix of native and managed code and you are only interested in one or the other, you can specify which code to profile.
- Automatically resume collection after (sec):
- If you want to skip the initialization phase of your application and focus on calculations, you can start your application with VTune paused, and then resume it after a set number of seconds.
- Automatically stop collection after (sec):
- Set this to profile a certain number of seconds
- Analyze child processes
- If your application launches other processes, or you are using a script, you can specify which process you want to analyze, and whether you want to analyze their children.
- Duration time estimate
- This allows VTune to more accurately determine how frequently it should sample events. For long-running collections, events can be sampled less frequently to avoid overly large results. Shorter collections will sample more frequently to make sure enough samples are collected for better reliability.
- Limit collected data by:
- Time from collection end, sec
- This will discard all but the results needed for the last n seconds of the collection. This is helpful to focus on an event or processing that occurs at a later point in the application’s run.
- Result size from collection start, MB
- When VTune determines that it will hit this limit, it will automatically stop the collection. While useful to avoid inadvertently creating a huge result, this may result in the collection terminating too soon. It can be increased or decreased, but it’s better to find other ways to shrink the result.
- Time from collection end, sec
- CPU mask
- Set this to only collect on specific CPUs. This can dramatically decrease the result size for data parallel applications running the same task over many CPUs.
How?
The next part of configuring the analysis is the How pane. First, decide which analysis type you want to run. Check the User Guide for descriptions of all the pre-defined analysis types available.
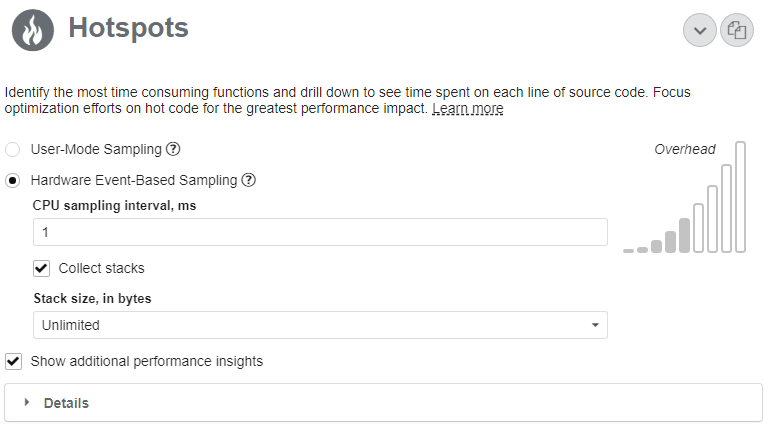
Depending on the analysis type, there are additional options you can choose:
- CPU sampling interval, ms
- This is defaulted to 10 for the hotspots and threading analysis types, and 1-5 for the others. Changing this will affect the reliability of the results and the result size. Use the default for the first analysis, and reduce the value if the metrics of interest show as low confidence (grey value).
- Reducing the value too much can result in missed samples, particularly for analysis types that sample a large number of events such as Microarchitecture Exploration. VTune may be unable to keep up.
- Collect stacks
- This can add a high amount of overhead for collections using hardware-based sampling.
- Show additional performance insights
- This option does a small amount of hardware-based sampling to determine next steps and provide recommendations.
Analysis types such as hotspots with event-based sampling have other details you can collect, such as memory bandwidth. Each of these adds overhead to the collection. For larger applications, it is best to first run a basic analysis to determine where to focus, and then configure the collection to focus on that area before adding these details.
Instrumentation and Tracing API (ITT)
The ITT APIs allow you to annotate your code to tell VTune specifically what and when to collect, and how to display it. For more information, see this section in the VTune Help guide. This article will focus on the Collection Control API. It contains three simple primitives that allow you to focus your collection without trying to guess a time span in the analysis configuration. Simply add the __itt_pause primitive in areas you want to ignore, and __itt_resume in functions you want to collect on. VTune may still collect some critical information while the collection is paused, but you can completely detach VTune from your application with the __itt_detach primitive. You can start your VTune analysis automatically in the paused state.