Visible to Intel only — GUID: GUID-A3D5FA96-466D-463B-87C3-E9153B591809
Visible to Intel only — GUID: GUID-A3D5FA96-466D-463B-87C3-E9153B591809
Profile KVM Kernel and User Space from the Host
In this mode, Intel® VTune™ Profiler collects two traces in parallel: system-wide performance data trace on the host and OS-level event trace on the guest system. These traces get merged into one VTune Profiler result and provide:
simultaneous analysis of user space activity (processes, threads, functions) from the host on the guest system;
accurate attribution of collected data to the user processes running on the guest, based on the timestamp synchronization.
This usage mode provides the following advantages:
VMs are not required to virtualize performance counters. All performance analysis features are available to VM users out of the box.
Sampling drivers (VTune Profiler sampling driver or Perf*) do not need to be installed on a guest VM.
To enable KVM kernel and user space profiling from the host:
- Install the VTune Profiler on the host and virtual machine.
NOTE:
You do not need to install sampling drivers.
- On both host and guest systems, run the script from the bin64 folder as a root:
$ prepare-debugfs.sh -g <user_group>
$ echo 0 > /proc/sys/kernel/perf_event_paranoid
- Configure a password-less SSH access from the host to the KVM guest system.
- If your host system is multi-socket, export the environment variable to set the time source to TSC before starting the VTune Amplfier:
VTUNE_RUNTOOL_OPTIONS=--time-source=tsc
- Create a project.
- From the WHAT pane in the Configure Analysis window, expand the Advanced section and enter the following string to the Custom collector field:
python <vtune_install_dir>/bin64/kvm-custom-collector.py --kvm-ssh-login=<username>@<kvm_ssh_ip> --vtune-dir-on-kvm=<vtune-install-dir>NOTE:
For additional details on particular options, see the kvm-custom-collector.py script help.
- To collect data from the guest kernel space, select the Analyze KVM Guest OS option.
Copy /proc/kallsyms and /proc/modules files from the virtual machine to the host.
NOTE:Since these are pseudo-files, you are recommended to cat their content into a regular file and then copy it to the host. Specify paths to the copied files in the project properties.
- From the HOW pane, select any hardware event-based sampling analysis (for example, General Exploration) and run the analysis from the host.
Explore the collected data by enabling all the grouping levels containing a VM component to differentiate the host and target data.
Example 1: Hotspots Analysis (Hardware Event-Based Sampling Mode)
Analyze hotspots for both an application launched from the Linux host, app-from-host, and an application launched on the KVM guest system, app-in-vm:

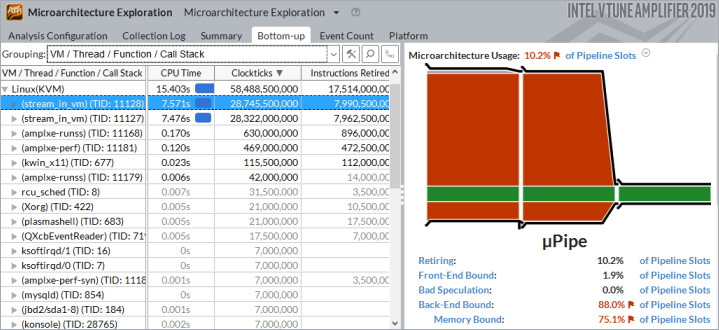
Example 2: Microarchitecture Exploration Analysis
Analyze the efficiency of the Microarchitecture Usage for the application launched on the KVM guest system. The context summary on the right pane shows the hardware metrics for the thread (launched inside the KVM) selected in the grid:

System Requirements and Limitations
Minimum Linux kernel version for host system is 4.9.
debugfs is mounted on both host and guest system.
Irrespective of the number of KVM/Qemu processes running, only one running VM instance can be profiled.
In the result view, threads with the same name may be grouped into one process (ftrace).
In the result view, samples before the first context switch may be attributed to the hypervisor thread on the host.