Visible to Intel only — GUID: GUID-8C32F53E-2A20-41BD-B26E-CBB26D98A296
Prepare Application for Analysis
Windows* Targets
Linux* Targets
Embedded Linux* Targets
FreeBSD* Targets
QNX* Targets
Managed Code Targets
Android* Targets
Intel® Xeon Phi™ Processor Targets
Targets in Virtualized Environments
Targets in a Cloud Environment
Arbitrary Targets
Embedded System Targets
Build and Install the Sampling Drivers for Linux* Targets
Debug Information for Linux* Application Binaries
Compiler Switches for Performance Analysis on Linux* Targets
Enable Linux* Kernel Analysis
Resolution of Symbol Names for Linux-Loadable Kernel Modules
Analyze Statically Linked Binaries on Linux* Targets
Set Up Remote Linux* Target
User-Mode Sampling and Tracing Collection
Hardware Event-based Sampling Collection
Performance Snapshot
Algorithm Group
Microarchitecture Analysis Group
Parallelism Analysis Group
Input and Output Analysis
Accelerators Analysis Group
Platform Analysis Group
Hybrid CPU Analysis
Source Code Analysis
Custom Analysis
Energy Analysis
Code Profiling Scenarios
Control Data Collection
Manage Data Views
Manage Result Files
Switch Viewpoints
Control Window Synchronization
View Stacks
Manage Grid Views
Manage Timeline View
Change Threshold Values
Choose Data Format
Group and Filter Data
View Data on Inline Functions
Analyze Loops
Stitch Stacks for Intel® oneAPI Threading Building Blocks or OpenMP* Analysis
Search for Data
performance-snapshot Command Line Analysis
hotspots Command Line Analysis
anomaly-detection Command Line Analysis
threading Command Line Analysis
memory-consumption Command Line Analysis
hpc-performance Command Line Analysis
uarch-exploration Command Line Analysis
memory-access Command Line Analysis
tsx-exploration Command Line Analysis
tsx-hotspots Command Line Analysis
sgx-hotspots Command Line Analysis
gpu-hotspots Command Line Analysis
gpu-offload Command Line Analysis
graphics-rendering Command Line Analysis
fpga-interaction Command Line Analysis
io Command Line Analysis
system-overview Command Line Analysis
platform-profiler Command Line Analysis
runsa/runss Custom Command Line Analysis
Configure Analysis Options from Command Line
Collect System-Wide Data from Command Line
Collect Data on Remote Linux* Systems from Command Line
Configure GPU Analysis from Command Line
Specify Search Directories from Command Line
Specify Result Directory from Command Line
Pause Collection from Command Line
Manage Analysis Duration from Command Line
Limit Data Collection from Command Line
Option Descriptions and General Rules
allow-multiple-runs
analyze-kvm-guest
analyze-system
app-working-dir
call-stack-mode
collect
collect-with
column
command
cpu-mask
csv-delimiter
cumulative-threshold-percent
custom-collector
data-limit
discard-raw-data
duration
filter
finalization-mode
finalize
format
group-by
help
import
inline-mode
knob
kvm-guest-kallsyms
kvm-guest-modules
limit
loop-mode
mrte-mode
no-follow-child
no-summary
no-unplugged-mode
quiet
report
report-knob
report-output
report-width
result-dir
resume-after
return-app-exitcode
ring-buffer
search-dir
show-as
sort-asc
sort-desc
source-object
source-search-dir
stack-size
start-paused
strategy
target-install-dir
target-system
target-tmp-dir
target-duration-type
target-pid
target-process
time-filter
trace-mpi
user-data-dir
verbose
version
Best Practices: Resolve Intel® VTune™ Profiler BSODs, Crashes, and Hangs in Windows* OS
Error Message: Application Sets Its Own Handler for Signal
Error Message: Cannot Enable Event-Based Sampling Collection
Error Message: Cannot Collect GPU Hardware Metrics
Error Message: Cannot Collect GPU Hardware Metrics for the Selected GPU Adapter
Error Message: Cannot Load Data File
Error Message: Cannot Locate Debugging Information
Error Message: Cannot Open Data
Error Message: Client Is Not Authorized to Connect to Server
Error Message: Root Privileges Required for Processor Graphics Events
Error Message: No Pre-built Driver Exists for This System
Error Message: Not All OpenCL™ API Profiling Callbacks Are Received
Error Message: Problem Accessing the Sampling Driver
Error Message: Required Key Not Available
Error Message: Scope of ptrace System Call Is Limited
Error Message: Stack Size Is Too Small
Error Message: Symbol File Is Not Found
Problem: Analysis of the .NET* Application Fails
Problem: Cannot Access VTune Profiler Documentation
Problem: CPU time for Hotspots or Threading Analysis is Too Low
Problem: 'Events= Sample After Value (SAV) * Samples' Is Not True If Multiple Runs Are Disabled
Problem: Guessed Stack Frames
Problem: GUI Hangs or Crashes
Problem: Inaccurate Sum in the Grid
Problem: Information Collected via ITT API Is Not Available When Attaching to a Process
Problem: No GPU Utilization Data Is Collected
Problem: Same Functions Are Compared As Different Instances
Problem: Skipped Stack Frames
Problem: Stack in the Top-Down Tree Window Is Incorrect
Problem: Stacks in Call Stack and Bottom-Up Panes Are Different
Problem: System Functions Appear in the User Functions Only Mode
Problem: VTune Profiler is Slow to Respond When Collecting or Displaying Data
Problem: VTune Profiler is Slow on X-Servers with SSH Connection
Problem: Unexpected Paused Time
Problem: {Unknown Timer} in the Platform Power Analysis Viewpoint
Problem: Unknown Critical Error Due to Disabled Loopback Interface
Problem: Unknown Frames
Problem: Unreadable Text on macOS*
Problem: Unsupported Microsoft* Windows* OS
Warnings about Accurate CPU Time Collection
Context Menu: Grid
Context Menus: Call Stack Pane
Context Menus: Project Navigator
Context Menus: Source/Assembly Window
Dialog Box: Binary/Symbol Search
Dialog Box: Source Search
Hot Keys
Menu: Customize Grouping
Menu: Intel VTune Profiler
Pane: Call Stack
Pane: Options - General
Pane: Options - Result Location
Pane: Options - Source/Assembly
Project Navigator
Pane: Timeline
Toolbar: Configure Analysis
Toolbar: Filter
Toolbar: Source/Assembly
Toolbar: Intel VTune Profiler
Window: Bandwidth - Platform Power Analysis
Window: Bottom-up
Window: Caller/Callee
Window: Cannot Find <file type> File
Window: Collection Log
Window: Compare Results
Window: Configure Analysis
Window: Core Wake-ups - Platform Power Analysis
Window: Correlate Metrics - Platform Power Analysis
Window: CPU C/P States - Platform Power Analysis
Window: Debug
Window: Event Count - Hardware Events
Window: Flame Graph
Window: Graphics - GPU Compute/Media Hotspots
Window: Graphics C/P States - Platform Power Analysis
Window: NC Device States - Platform Power Analysis
Window: Platform
Window: Platform Power Analysis
Window: Sample Count - Hardware Events
Window: SC Device States - Platform Power Analysis
Window: Summary
Window: System Sleep States - Platform Power Analysis
Window: Temperature/Thermal Sample - Platform Power Analysis
Window: Timer Resolution - Platform Power Analysis
Window: Top-down Tree
Window: Uncore Event Count - Hardware Events
Window: Wakelocks - Platform Power Analysis
Window: Summary - Input and Output Summary
Window: Summary - Microarchitecture Exploration
Window: Summary - GPU Analysis
Window: Summary - Hardware Events
Window: Summary - Hotspots by CPU Utilization
Window: Summary - HPC Performance Characterization
Window: Summary - Memory Consumption
Window: Summary - Memory Usage
Analysis Metrics
System Bandwidth
Bandwidth Utilization Histogram
Top Memory Objects by Latency (Linux* Targets Only)
Top Tasks
Latency Histogram
Collection and Platform Info
Window: Summary - Platform Power Analysis
Average Time
Computing Threads Started
Computing Threads Started, Threads/sec
CPU Time
EU 2 FPU Pipelines Active
EU Array Active
EU Array Idle
EU Array Stalled/Idle
EU Array Stalled
EU IPC Rate
EU Send pipeline active
EU Threads Occupancy
Global
GPU EU Array Usage
GPU L3 Bound
GPU L3 Miss Ratio
GPU L3 Misses
GPU L3 Misses, Misses/sec
GPU Memory Read Bandwidth, GB/sec
GPU Memory Texture Read Bandwidth, GB/sec
GPU Memory Write Bandwidth, GB/sec
GPU Texel Quads Count, Count/sec
GPU Utilization
Instance Count
L3 Sampler Bandwidth, GB/sec
L3 Shader Bandwidth, GB/sec
LLC Miss Rate due GPU Lookups
LLC Miss Ratio due GPU Lookups
Local
Maximum GPU Utilization
Occupancy
PS EU Active %
PS EU Stall %
Ratio to Max Bandwidth, %
Ratio to Max Bandwidth, %
Ratio to Max Bandwidth, %
Render/GPGPU Command Streamer Loaded
Samples Blended
Samples Killed in PS, pixels
Samples Written
Sampler Busy
Sampler Is Bottleneck
Shared Local Memory Read Bandwidth, GB/sec
Shared Local Memory Write Bandwidth, GB/sec
SIMD Width
Size
Total, GB/sec
Total Time
Typed Memory Read Bandwidth, GB/sec
Typed Memory Write Bandwidth, GB/sec
Typed Reads Coalescence
Typed Writes Coalescence
Untyped Memory Read Bandwidth, GB/sec
Untyped Memory Write Bandwidth, GB/sec
Untyped Reads Coalescence
Untyped Writes Coalescence
VS EU Active
VS EU Stall
Visible to Intel only — GUID: GUID-8C32F53E-2A20-41BD-B26E-CBB26D98A296
Window: Summary - Memory Usage
Use the Summary window as your starting point of the performance analysis with the Intel® VTune™ Profiler. To access this window, select the Memory Usage viewpoint and click the Summary sub-tab in the result tab.
Depending on the analysis type, the Summary window provides the following application-level statistics in the Memory Usage viewpoint:
NOTE:
You may click the  Copy to Clipboard button to copy the content of the selected summary section to the clipboard.
Analysis Metrics
The Summary window displays a list of memory-related CPU metrics that help you estimate an overall memory usage during application execution. For a metric description, hover over the corresponding question mark icon  to read the pop-up help:
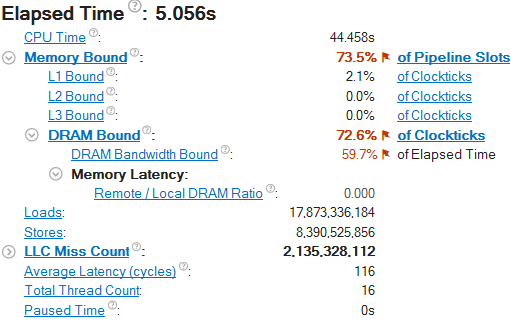
Memory Bound metrics are measured either as Clockticks or as Pipeline Slots. Metrics measured in Clockticks are less precise compared to the metrics measured in Pipeline Slots since they may overlap and their sum at some level does not necessarily match the parent metric value. But such metrics are still useful for identifying the dominant performance bottleneck in the code.
Mouse over a flagged value with the performance issue and read the recommendation for further analysis. For example, a high Memory Bound value typically indicates that a significant fraction of the execution pipeline slots could be stalled due to a demand memory load and stores. For further details, you may switch to the Bottom-up window and explore metric data per memory object.
A high DRAM Bandwidth Bound metric value indicates that your system spent much time heavily utilizing the DRAM bandwidth. The calculation of this metric relies on the accurate maximum system DRAM bandwidth measurement provided in the System Bandwidth section below.
System Bandwidth
This section provides various system bandwidth-related properties detected by the product. Depending on the number of sockets on your system, the following types of system bandwidth are measured:
Max DRAM System Bandwidth |
Maximum DRAM bandwidth measured for the whole system (across all packages) by running a micro-benchmark before the collection starts. If the system has already been actively loaded at the moment of collection start (for example, with the attach mode), the value may be less accurate. |
Max DRAM Single-Package Bandwidth |
Maximum DRAM bandwidth for single package measured by running a micro-benchmark before the collection starts. If the system has already been actively loaded at the moment of collection start (for example, with the attach mode), the value may be less accurate. |
These values are used to define default High, Medium and Low bandwidth utilization thresholds for the Bandwidth Utilization Histogram and to scale over-time bandwidth graphs in the Bottom-up view. By default, for Memory Analysis results the system bandwidth is measured automatically. To enable this functionality for custom analysis results, make sure to select the Evaluate max DRAM bandwidth option.
Bandwidth Utilization Histogram
This histogram shows how much time the system bandwidth was utilized by a certain value (Bandwidth Domain) and provides thresholds to categorize bandwidth utilization as High, Medium and Low. You can set the threshold by moving sliders at the bottom.
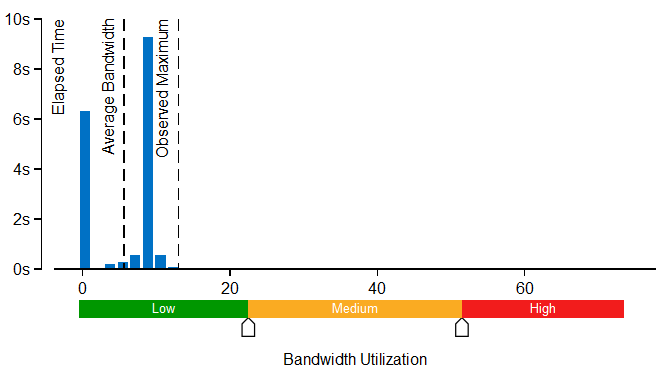
If you switch to the Bottom-up window and group the grid data by ../Bandwidth Utilization Type/.., you can identify functions or memory objects with high bandwidth utilization in the specific bandwidth domain.
If you select the Interconnect domain, you will be able to check whether the performance of your application is limited by the bandwidth of Interconnect links (inter-socket connections). Then, you may switch to the Bottom-up window and identify code and memory objects with NUMA issues.
Single-Package domains are displayed for the systems with two or more CPU packages and the histogram for them shows the distribution of the elapsed time per maximum bandwidth utilization among all packages. Use this data to identify situations where your application utilizes bandwidth only on a subset of CPU packages. In this case, the whole system bandwidth utilization represented by domains like DRAM may be low whereas the performance is in fact limited by bandwidth utilization.
NOTE:
Interconnect bandwidth analysis is supported by the VTune Profiler for Intel microarchitecture code name Ivy Bridge EP and later.
To learn bandwidth capabilities, refer to your system specifications or run appropriate benchmarks to measure them; for example, Intel Memory Latency Checker can provide maximum achievable DRAM and Interconnect bandwidth.
Top Memory Objects by Latency (Linux* Targets Only)
If you enabled the Analyze memory object configuration option for the Memory Access analysis, the Summary window in the Memory Usage viewpoint displays memory objects (variables, data structures, arrays) that introduced the highest latency to the execution of your application.
NOTE:
Memory objects identification is supported only for Linux targets and only for processors based on Intel microarchitecture code name Sandy Bridge and later.
Only metrics based on DLA-capable hardware events are applicable to the memory objects analysis. For example, the CPU Time metric is based on a non DLA-capable Clockticks event, so cannot be applied to memory objects. Examples of applicable metrics are Loads, Stores, LLC Miss Count, and Average Latency.
Clicking an object in the table opens the Bottom-up window with the grid data grouped by Memory Object/Function/Allocation Stack. The selected hotspot object is highlighted.
Top Tasks
This section provides a list of tasks that took most of the time to execute, where tasks are either code regions marked with Task API, or system tasks enabled to monitor Ftrace* events, Atrace* events, Intel Media SDK programs, OpenCL™ kernels, and so on.
Clicking a task type in the table opens the grid view (for example, Bottom-up or Event Count) grouped by the Task Type granularity. See Task Analysis for more information.
Latency Histogram
This histogram shows a distribution of loads per latency (in cycles).
Collection and Platform Info
This section provides the following data:
Application Command Line |
Path to the target application. |
Operating System |
Operating system used for the collection. |
Computer Name |
Name of the computer used for the collection. |
Result Size |
Size of the result collected by the VTune Profiler. |
Collection start time |
Start time (in UTC format) of the external collection. Explore the Timeline pane to track the performance statistics provided by the custom collector over time. |
Collection stop time |
Stop time (in UTC format) of the external collection. Explore the Timeline pane to track the performance statistics provided by the custom collector over time. |
Collector type |
Type of the data collector used for the analysis. The following types are possible:
|
CPU Information |
|
Name |
Name of the processor used for the collection. |
Frequency |
Frequency of the processor used for the collection. |
Logical CPU Count |
Logical CPU count for the machine used for the collection. |
Physical Core Count |
Number of physical cores on the system. |
User Name |
User launching the data collection. This field is available if you enabled the per-user event-based sampling collection mode during the product installation. |
GPU Information |
|
Name |
Name of the Graphics installed on the system. |
Vendor |
GPU vendor. |
Driver |
Version of the graphics driver installed on the system. |
Stepping |
Microprocessor version. |
EU Count |
Number of execution units (EUs) in the Render and GPGPU engine. This data is Intel® HD Graphics and Intel® Iris® Graphics (further: Intel Graphics) specific. |
Max EU Thread Count |
Maximum number of threads per execution unit. This data is Intel Graphics specific. |
Max Core Frequency |
Maximum frequency of the Graphics processor. This data is Intel Graphics specific. |
Graphics Performance Analysis |
GPU metrics collection is enabled on the hardware level. This data is Intel Graphics specific.
NOTE:
Some systems disable collection of extended metrics such as L3 misses, memory accesses, sampler busyness, SLM accesses, and others in the BIOS. On some systems you can set a BIOS option to enable this collection. The presence or absence of the option and its name are BIOS vendor specific. Look for the Intel® Graphics Performance Analyzers option (or similar) in your BIOS and set it to Enabled. |
Parent topic: Window: Summary