Visible to Intel only — GUID: GUID-8FCE6EF8-301B-4D62-B09E-EF79FE7CC33D
Prepare Application for Analysis
Windows* Targets
Linux* Targets
Embedded Linux* Targets
FreeBSD* Targets
QNX* Targets
Managed Code Targets
Android* Targets
Intel® Xeon Phi™ Processor Targets
Targets in Virtualized Environments
Targets in a Cloud Environment
Arbitrary Targets
Embedded System Targets
Build and Install the Sampling Drivers for Linux* Targets
Debug Information for Linux* Application Binaries
Compiler Switches for Performance Analysis on Linux* Targets
Enable Linux* Kernel Analysis
Resolution of Symbol Names for Linux-Loadable Kernel Modules
Analyze Statically Linked Binaries on Linux* Targets
Set Up Remote Linux* Target
User-Mode Sampling and Tracing Collection
Hardware Event-based Sampling Collection
Performance Snapshot
Algorithm Group
Microarchitecture Analysis Group
Parallelism Analysis Group
Input and Output Analysis
Accelerators Analysis Group
Platform Analysis Group
Hybrid CPU Analysis
Source Code Analysis
Custom Analysis
Energy Analysis
Code Profiling Scenarios
Control Data Collection
Manage Data Views
Manage Result Files
Switch Viewpoints
Control Window Synchronization
View Stacks
Manage Grid Views
Manage Timeline View
Change Threshold Values
Choose Data Format
Group and Filter Data
View Data on Inline Functions
Analyze Loops
Stitch Stacks for Intel® oneAPI Threading Building Blocks or OpenMP* Analysis
Search for Data
performance-snapshot Command Line Analysis
hotspots Command Line Analysis
anomaly-detection Command Line Analysis
threading Command Line Analysis
memory-consumption Command Line Analysis
hpc-performance Command Line Analysis
uarch-exploration Command Line Analysis
memory-access Command Line Analysis
tsx-exploration Command Line Analysis
tsx-hotspots Command Line Analysis
sgx-hotspots Command Line Analysis
gpu-hotspots Command Line Analysis
gpu-offload Command Line Analysis
graphics-rendering Command Line Analysis
fpga-interaction Command Line Analysis
io Command Line Analysis
system-overview Command Line Analysis
platform-profiler Command Line Analysis
runsa/runss Custom Command Line Analysis
Configure Analysis Options from Command Line
Collect System-Wide Data from Command Line
Collect Data on Remote Linux* Systems from Command Line
Configure GPU Analysis from Command Line
Specify Search Directories from Command Line
Specify Result Directory from Command Line
Pause Collection from Command Line
Manage Analysis Duration from Command Line
Limit Data Collection from Command Line
Option Descriptions and General Rules
allow-multiple-runs
analyze-kvm-guest
analyze-system
app-working-dir
call-stack-mode
collect
collect-with
column
command
cpu-mask
csv-delimiter
cumulative-threshold-percent
custom-collector
data-limit
discard-raw-data
duration
filter
finalization-mode
finalize
format
group-by
help
import
inline-mode
knob
kvm-guest-kallsyms
kvm-guest-modules
limit
loop-mode
mrte-mode
no-follow-child
no-summary
no-unplugged-mode
quiet
report
report-knob
report-output
report-width
result-dir
resume-after
return-app-exitcode
ring-buffer
search-dir
show-as
sort-asc
sort-desc
source-object
source-search-dir
stack-size
start-paused
strategy
target-install-dir
target-system
target-tmp-dir
target-duration-type
target-pid
target-process
time-filter
trace-mpi
user-data-dir
verbose
version
Best Practices: Resolve Intel® VTune™ Profiler BSODs, Crashes, and Hangs in Windows* OS
Error Message: Application Sets Its Own Handler for Signal
Error Message: Cannot Enable Event-Based Sampling Collection
Error Message: Cannot Collect GPU Hardware Metrics
Error Message: Cannot Collect GPU Hardware Metrics for the Selected GPU Adapter
Error Message: Cannot Load Data File
Error Message: Cannot Locate Debugging Information
Error Message: Cannot Open Data
Error Message: Client Is Not Authorized to Connect to Server
Error Message: Root Privileges Required for Processor Graphics Events
Error Message: No Pre-built Driver Exists for This System
Error Message: Not All OpenCL™ API Profiling Callbacks Are Received
Error Message: Problem Accessing the Sampling Driver
Error Message: Required Key Not Available
Error Message: Scope of ptrace System Call Is Limited
Error Message: Stack Size Is Too Small
Error Message: Symbol File Is Not Found
Problem: Analysis of the .NET* Application Fails
Problem: Cannot Access VTune Profiler Documentation
Problem: CPU time for Hotspots or Threading Analysis is Too Low
Problem: 'Events= Sample After Value (SAV) * Samples' Is Not True If Multiple Runs Are Disabled
Problem: Guessed Stack Frames
Problem: GUI Hangs or Crashes
Problem: Inaccurate Sum in the Grid
Problem: Information Collected via ITT API Is Not Available When Attaching to a Process
Problem: No GPU Utilization Data Is Collected
Problem: Same Functions Are Compared As Different Instances
Problem: Skipped Stack Frames
Problem: Stack in the Top-Down Tree Window Is Incorrect
Problem: Stacks in Call Stack and Bottom-Up Panes Are Different
Problem: System Functions Appear in the User Functions Only Mode
Problem: VTune Profiler is Slow to Respond When Collecting or Displaying Data
Problem: VTune Profiler is Slow on X-Servers with SSH Connection
Problem: Unexpected Paused Time
Problem: {Unknown Timer} in the Platform Power Analysis Viewpoint
Problem: Unknown Critical Error Due to Disabled Loopback Interface
Problem: Unknown Frames
Problem: Unreadable Text on macOS*
Problem: Unsupported Microsoft* Windows* OS
Warnings about Accurate CPU Time Collection
Context Menu: Grid
Context Menus: Call Stack Pane
Context Menus: Project Navigator
Context Menus: Source/Assembly Window
Dialog Box: Binary/Symbol Search
Dialog Box: Source Search
Hot Keys
Menu: Customize Grouping
Menu: Intel VTune Profiler
Pane: Call Stack
Pane: Options - General
Pane: Options - Result Location
Pane: Options - Source/Assembly
Project Navigator
Pane: Timeline
Toolbar: Configure Analysis
Toolbar: Filter
Toolbar: Source/Assembly
Toolbar: Intel VTune Profiler
Window: Bandwidth - Platform Power Analysis
Window: Bottom-up
Window: Caller/Callee
Window: Cannot Find <file type> File
Window: Collection Log
Window: Compare Results
Window: Configure Analysis
Window: Core Wake-ups - Platform Power Analysis
Window: Correlate Metrics - Platform Power Analysis
Window: CPU C/P States - Platform Power Analysis
Window: Debug
Window: Event Count - Hardware Events
Window: Flame Graph
Window: Graphics - GPU Compute/Media Hotspots
Window: Graphics C/P States - Platform Power Analysis
Window: NC Device States - Platform Power Analysis
Window: Platform
Window: Platform Power Analysis
Window: Sample Count - Hardware Events
Window: SC Device States - Platform Power Analysis
Window: Summary
Window: System Sleep States - Platform Power Analysis
Window: Temperature/Thermal Sample - Platform Power Analysis
Window: Timer Resolution - Platform Power Analysis
Window: Top-down Tree
Window: Uncore Event Count - Hardware Events
Window: Wakelocks - Platform Power Analysis
Window: Summary - Input and Output Summary
Window: Summary - Microarchitecture Exploration
Window: Summary - GPU Analysis
Window: Summary - Hardware Events
Window: Summary - Hotspots by CPU Utilization
Window: Summary - HPC Performance Characterization
Window: Summary - Memory Consumption
Window: Summary - Memory Usage
Window: Summary - Platform Power Analysis
Average Time
Computing Threads Started
Computing Threads Started, Threads/sec
CPU Time
EU 2 FPU Pipelines Active
EU Array Active
EU Array Idle
EU Array Stalled/Idle
EU Array Stalled
EU IPC Rate
EU Send pipeline active
EU Threads Occupancy
Global
GPU EU Array Usage
GPU L3 Bound
GPU L3 Miss Ratio
GPU L3 Misses
GPU L3 Misses, Misses/sec
GPU Memory Read Bandwidth, GB/sec
GPU Memory Texture Read Bandwidth, GB/sec
GPU Memory Write Bandwidth, GB/sec
GPU Texel Quads Count, Count/sec
GPU Utilization
Instance Count
L3 Sampler Bandwidth, GB/sec
L3 Shader Bandwidth, GB/sec
LLC Miss Rate due GPU Lookups
LLC Miss Ratio due GPU Lookups
Local
Maximum GPU Utilization
Occupancy
PS EU Active %
PS EU Stall %
Ratio to Max Bandwidth, %
Ratio to Max Bandwidth, %
Ratio to Max Bandwidth, %
Render/GPGPU Command Streamer Loaded
Samples Blended
Samples Killed in PS, pixels
Samples Written
Sampler Busy
Sampler Is Bottleneck
Shared Local Memory Read Bandwidth, GB/sec
Shared Local Memory Write Bandwidth, GB/sec
SIMD Width
Size
Total, GB/sec
Total Time
Typed Memory Read Bandwidth, GB/sec
Typed Memory Write Bandwidth, GB/sec
Typed Reads Coalescence
Typed Writes Coalescence
Untyped Memory Read Bandwidth, GB/sec
Untyped Memory Write Bandwidth, GB/sec
Untyped Reads Coalescence
Untyped Writes Coalescence
VS EU Active
VS EU Stall
Visible to Intel only — GUID: GUID-8FCE6EF8-301B-4D62-B09E-EF79FE7CC33D
Microarchitecture Exploration View
Explore the Intel® VTune™ Profiler Microarchitecture Exploration viewpoint for the PMU analysis based on the top-down microarchitecture analysis method that uses key hardware metrics organized by execution categories so that you could easily identify what portion of the pipeline is responsible for the majority of execution time.
When the Microarchitecture Exploration analysis (formerly known as General Exploration) is complete, the VTune Profiler opens the Microarchitecture Exploration viewpoint. The hierarchy of event-based metrics in this viewpoint depends on your hardware architecture. For example, starting with the Intel microarchitecture code name Ivy Bridge, the VTune Profiler analyzes execution categories based on the Top-Down Microarchitecture Analysis Method:
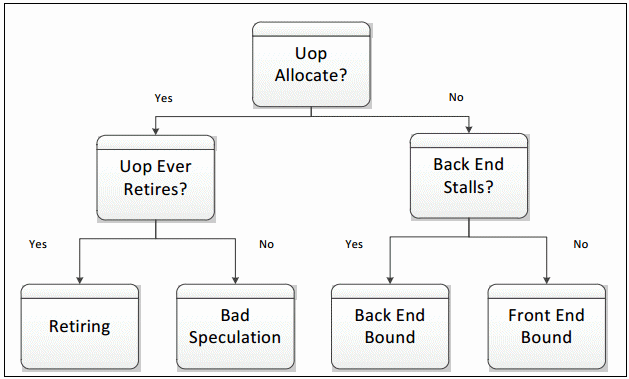
The four leaf categories serve as high-level performance metrics in the Microarchitecture Exploration viewpoint.
Each metric is an event ratio defined by Intel architects and has its own predefined threshold. VTune Profiler analyzes a ratio value for each aggregated program unit (for example, function). When this value exceeds the threshold and the program unit has more then 5% of CPU time from collection CPU time, it signals a potential performance problem and highlights such a value in pink.
NOTE:
For a detailed tuning methodology behind the Microarchitecture Exploration analysis and some of the complexities associated with this analysis, see Understanding How General Exploration Works in Intel® VTune™ Profiler.
For architecture-specific Tuning Guides, visit https://software.intel.com/en-us/articles/processor-specific-performance-analysis-papers.
To interpret the performance data provided during the hardware event-based sampling analysis, you may follow the steps below:
Learn Metrics and Define a Performance Baseline
In the Microarchitecture Exploration viewpoint, click the Summary tab to switch to the Summary window.
The first section displays the summary statistics on the overall application execution per hardware-related metrics measured in Pipeline Slots or Clockticks. Metrics are organized by execution categories in a list and also represented as a µPipe diagram. To view a metric description, mouse over the help icon  :
:
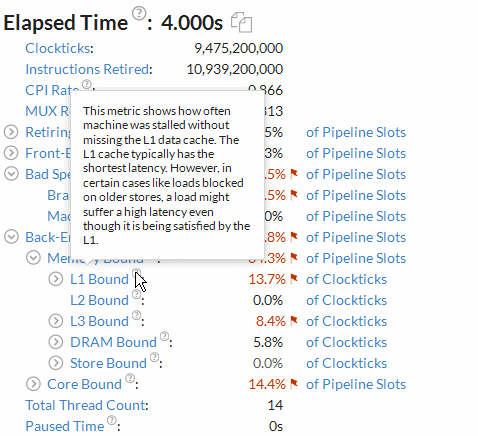
In the example above, mousing over the L1 Bound metric displays the metric description in the tooltip.
A flagged metric value signals a performance issue for the whole application execution. Mouse over the flagged value to read the issue description:
You may use the performance issues identified by the VTune Profiler as a baseline for comparison of versions before and after optimization. Your primary performance indicator is the Elapsed time value.
Grayed out metric values indicate that the data collected for this metric is unreliable. This may happen, for example, if the number of samples collected for PMU events is too low. In this case, when you hover over such an unreliable metric value, the VTune Profiler displays a message:
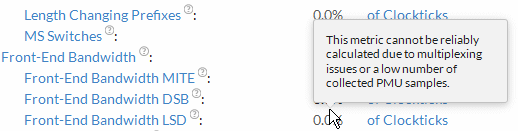
You may either ignore this data, or rerun the collection with the data collection time, sampling interval, or workload increased.
By default, the VTune Profiler collects Microarchitecture Exploration data in the Detailed mode. In this mode, all metric names in the Summary view are hyperlinks. Clicking such a hyperlink opens the Bottom-up window and sorts the data in the grid by the selected metric. The lightweight Summary collection mode is limited to the Summary view statistics.
Identify Hardware Issues
To view hardware issues per a program unit, switch to the Bottom-up pane. Each row represents a program unit and percentage of time used by this unit. Program units that take more than 5% of the CPU time are considered as hotspots. By default, the VTune Profiler sorts the data in the descending order by Clockticks and provides the hotspots at the top of the list.
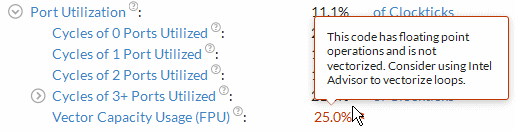
Most of the columns in the Bottom-up pane represent a hardware performance metric. VTune Profiler calculates a metric based on the formula provided by Intel architects. Mouse over the column header to read the metric description. By default, metric values are represented as numbers. You can change the representation mode with the Show Data As context menu option.
The right pane displays a context summary for the selected function. Analyze per-function hardware metrics and their visual representation on the µPipe diagram to estimate the contribution of this particular function to the overall performance.
Each metric has a threshold value. If the metric value exceeds the threshold and the program unit is a hotspot, the VTune Profiler highlights this value in pink as performance-critical. Mouse over each pink cell to read a description of the issue and recommended solution (if any).
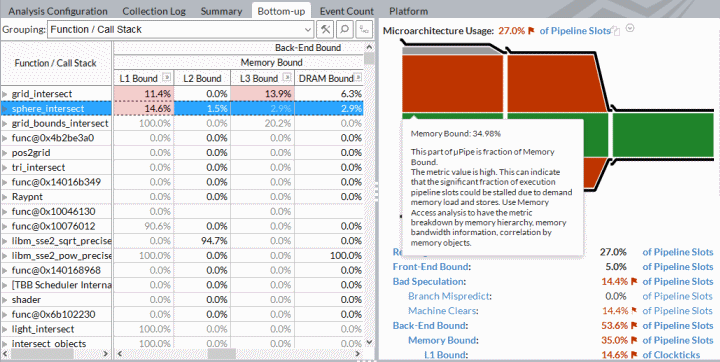
In the example above, created on the Intel microarchitecture code name Skylake, the VTune Profiler identified the sphere_intersect function as one of the biggest hotspots that took much CPU time. VTune Profiler detected that the back-end portion of the pipeline caused the stalls. For the back-end, the VTune Profiler identified Memory Bound > L1 Bound issue as a dominant bottleneck. 14.6% of Clockticks used in this function was stalled missing L1 data cache. This means that if you focus on this function hotspot and optimize it, you can potentially gain ~15% speed-up for this function.
VTune Profiler is able to identify the most common types of pipeline bottlenecks. You may go deeper for more details. If the deeper levels of the metrics do not display any data, it means that the VTune Profiler cannot see a dominant bottleneck on the lower level.
Analyze Source
When you identified a critical function, double-click it to open the Source/Assembly window and analyze the source code.
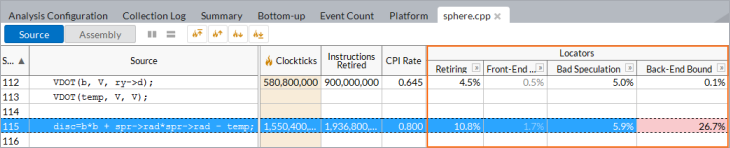
The Source/Assembly window displays locator metrics that show what code contributed the most to the issue represented by the metric. For example, if you have the Back-End Bound metric equal to 60% for your function, the source view for this function splits the 60% value across function source lines or instructions to help you identify a source line/instruction with the biggest value contributing the most to the total 60% Back-End Bound metric.
Use the hotspots navigation toolbar buttons to navigate to the biggest hotspot for each locator metric and identify the code to optimize.
What's Next
You may view the collected data using the Hotspots viewpoint or run the Hotspots analysis type. Analyzing the source and assembly code for the hotspot function in the Hotspots viewpoint helps identify which instruction contributes most to the poor performance and how much CPU time the hotspot source line takes. Such a code analysis could be useful for the hotspots that do not show any issues in the sub-metrics but do show problems at the upper level of metrics (see the example above).
Run the comparison analysis to understand the performance gain you obtained after your optimization.
You may create your custom analysis configuration and monitor events you are interested in.
NOTE:
For information on processor events, see the Intel Processor Event Reference.
Explore tuning recipes for hardware issues in the Performance Analysis Cookbook.