Visible to Intel only — GUID: GUID-C44910E5-7676-4782-AD88-BD5FDDB46E25
Visible to Intel only — GUID: GUID-C44910E5-7676-4782-AD88-BD5FDDB46E25
Analyze Loops
Use the Intel® VTune™ Profiler to view a hierarchy of the loops in your application call tree and identify code sections for optimization.
To view and analyze loops in your application:
- Create a custom analysis (for example, Loop Analysis) based on hardware event-based collection and select the Analyze loops, Estimate call counts, and Estimate trip counts options.
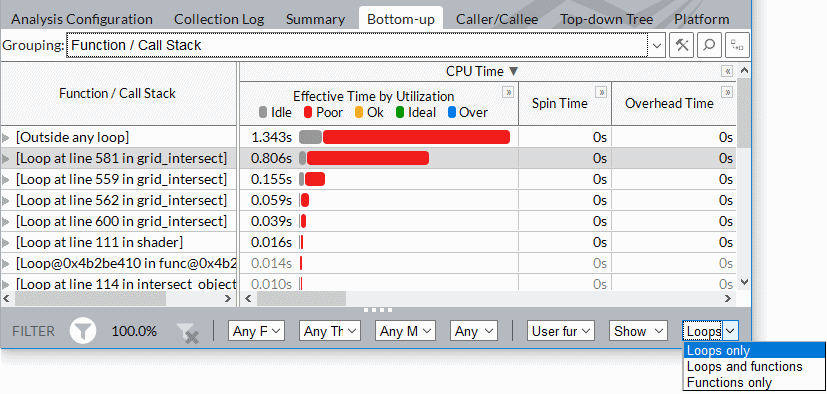
- Select the required filtering level from the Loop Mode drop-down menu on the Filter toolbar.
Loops only: Display loops as regular nodes in the tree. Loop name consists of:
start address of the loop
number of the code line where this loop is created
name of the function where this loop is created
Loops and functions: Display both loops and functions as separate nodes.
Functions only (default): Display data by function with no loop information.
VTune Profiler updates the grid according to the selected filtering level.
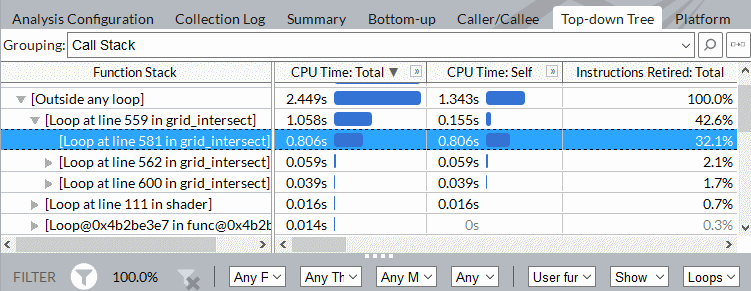
- Analyze Self and Total metrics in the Bottom-up and Top-down Tree windows and identify the most time-consuming loops.
- Double-click a loop of interest to view the source code.
VTune Profiler opens a source file for the function with the selected loop. The code line creating the loop is highlighted.
NOTE:You can see the code line information only if debug information for your function is available.
Examples
To identify the most time-consuming loop, select the Loops only mode in the Bottom-up window. By default, loops with the highest CPU Time values show up at the top of the grid.

To identify the heaviest top-level loops, switch to the Top-down Tree window. The data in the grid is sorted by the Total time metric displaying the hottest top-level loops first:
