Visible to Intel only — GUID: GUID-83549642-0E54-4173-8095-3DDC94BB84B4
Prepare Application for Analysis
Windows* Targets
Linux* Targets
Embedded Linux* Targets
FreeBSD* Targets
QNX* Targets
Managed Code Targets
Android* Targets
Intel® Xeon Phi™ Processor Targets
Targets in Virtualized Environments
Targets in a Cloud Environment
Arbitrary Targets
Embedded System Targets
Build and Install the Sampling Drivers for Linux* Targets
Debug Information for Linux* Application Binaries
Compiler Switches for Performance Analysis on Linux* Targets
Enable Linux* Kernel Analysis
Resolution of Symbol Names for Linux-Loadable Kernel Modules
Analyze Statically Linked Binaries on Linux* Targets
Set Up Remote Linux* Target
User-Mode Sampling and Tracing Collection
Hardware Event-based Sampling Collection
Performance Snapshot
Algorithm Group
Microarchitecture Analysis Group
Parallelism Analysis Group
Input and Output Analysis
Accelerators Analysis Group
Platform Analysis Group
Hybrid CPU Analysis
Source Code Analysis
Custom Analysis
Energy Analysis
Code Profiling Scenarios
Control Data Collection
Manage Data Views
Manage Result Files
Switch Viewpoints
Control Window Synchronization
View Stacks
Manage Grid Views
Manage Timeline View
Change Threshold Values
Choose Data Format
Group and Filter Data
View Data on Inline Functions
Analyze Loops
Stitch Stacks for Intel® oneAPI Threading Building Blocks or OpenMP* Analysis
Search for Data
performance-snapshot Command Line Analysis
hotspots Command Line Analysis
anomaly-detection Command Line Analysis
threading Command Line Analysis
memory-consumption Command Line Analysis
hpc-performance Command Line Analysis
uarch-exploration Command Line Analysis
memory-access Command Line Analysis
tsx-exploration Command Line Analysis
tsx-hotspots Command Line Analysis
sgx-hotspots Command Line Analysis
gpu-hotspots Command Line Analysis
gpu-offload Command Line Analysis
graphics-rendering Command Line Analysis
fpga-interaction Command Line Analysis
io Command Line Analysis
system-overview Command Line Analysis
platform-profiler Command Line Analysis
runsa/runss Custom Command Line Analysis
Configure Analysis Options from Command Line
Collect System-Wide Data from Command Line
Collect Data on Remote Linux* Systems from Command Line
Configure GPU Analysis from Command Line
Specify Search Directories from Command Line
Specify Result Directory from Command Line
Pause Collection from Command Line
Manage Analysis Duration from Command Line
Limit Data Collection from Command Line
Option Descriptions and General Rules
allow-multiple-runs
analyze-kvm-guest
analyze-system
app-working-dir
call-stack-mode
collect
collect-with
column
command
cpu-mask
csv-delimiter
cumulative-threshold-percent
custom-collector
data-limit
discard-raw-data
duration
filter
finalization-mode
finalize
format
group-by
help
import
inline-mode
knob
kvm-guest-kallsyms
kvm-guest-modules
limit
loop-mode
mrte-mode
no-follow-child
no-summary
no-unplugged-mode
quiet
report
report-knob
report-output
report-width
result-dir
resume-after
return-app-exitcode
ring-buffer
search-dir
show-as
sort-asc
sort-desc
source-object
source-search-dir
stack-size
start-paused
strategy
target-install-dir
target-system
target-tmp-dir
target-duration-type
target-pid
target-process
time-filter
trace-mpi
user-data-dir
verbose
version
Best Practices: Resolve Intel® VTune™ Profiler BSODs, Crashes, and Hangs in Windows* OS
Error Message: Application Sets Its Own Handler for Signal
Error Message: Cannot Enable Event-Based Sampling Collection
Error Message: Cannot Collect GPU Hardware Metrics
Error Message: Cannot Collect GPU Hardware Metrics for the Selected GPU Adapter
Error Message: Cannot Load Data File
Error Message: Cannot Locate Debugging Information
Error Message: Cannot Open Data
Error Message: Client Is Not Authorized to Connect to Server
Error Message: Root Privileges Required for Processor Graphics Events
Error Message: No Pre-built Driver Exists for This System
Error Message: Not All OpenCL™ API Profiling Callbacks Are Received
Error Message: Problem Accessing the Sampling Driver
Error Message: Required Key Not Available
Error Message: Scope of ptrace System Call Is Limited
Error Message: Stack Size Is Too Small
Error Message: Symbol File Is Not Found
Problem: Analysis of the .NET* Application Fails
Problem: Cannot Access VTune Profiler Documentation
Problem: CPU time for Hotspots or Threading Analysis is Too Low
Problem: 'Events= Sample After Value (SAV) * Samples' Is Not True If Multiple Runs Are Disabled
Problem: Guessed Stack Frames
Problem: GUI Hangs or Crashes
Problem: Inaccurate Sum in the Grid
Problem: Information Collected via ITT API Is Not Available When Attaching to a Process
Problem: No GPU Utilization Data Is Collected
Problem: Same Functions Are Compared As Different Instances
Problem: Skipped Stack Frames
Problem: Stack in the Top-Down Tree Window Is Incorrect
Problem: Stacks in Call Stack and Bottom-Up Panes Are Different
Problem: System Functions Appear in the User Functions Only Mode
Problem: VTune Profiler is Slow to Respond When Collecting or Displaying Data
Problem: VTune Profiler is Slow on X-Servers with SSH Connection
Problem: Unexpected Paused Time
Problem: {Unknown Timer} in the Platform Power Analysis Viewpoint
Problem: Unknown Critical Error Due to Disabled Loopback Interface
Problem: Unknown Frames
Problem: Unreadable Text on macOS*
Problem: Unsupported Microsoft* Windows* OS
Warnings about Accurate CPU Time Collection
Context Menu: Grid
Context Menus: Call Stack Pane
Context Menus: Project Navigator
Context Menus: Source/Assembly Window
Dialog Box: Binary/Symbol Search
Dialog Box: Source Search
Hot Keys
Menu: Customize Grouping
Menu: Intel VTune Profiler
Pane: Call Stack
Pane: Options - General
Pane: Options - Result Location
Pane: Options - Source/Assembly
Project Navigator
Pane: Timeline
Toolbar: Configure Analysis
Toolbar: Filter
Toolbar: Source/Assembly
Toolbar: Intel VTune Profiler
Window: Bandwidth - Platform Power Analysis
Window: Bottom-up
Window: Caller/Callee
Window: Cannot Find <file type> File
Window: Collection Log
Window: Compare Results
Window: Configure Analysis
Window: Core Wake-ups - Platform Power Analysis
Window: Correlate Metrics - Platform Power Analysis
Window: CPU C/P States - Platform Power Analysis
Window: Debug
Window: Event Count - Hardware Events
Window: Flame Graph
Window: Graphics - GPU Compute/Media Hotspots
Window: Graphics C/P States - Platform Power Analysis
Window: NC Device States - Platform Power Analysis
Window: Platform
Window: Platform Power Analysis
Window: Sample Count - Hardware Events
Window: SC Device States - Platform Power Analysis
Window: Summary
Window: System Sleep States - Platform Power Analysis
Window: Temperature/Thermal Sample - Platform Power Analysis
Window: Timer Resolution - Platform Power Analysis
Window: Top-down Tree
Window: Uncore Event Count - Hardware Events
Window: Wakelocks - Platform Power Analysis
Window: Summary - Input and Output Summary
Window: Summary - Microarchitecture Exploration
Window: Summary - GPU Analysis
Window: Summary - Hardware Events
Window: Summary - Hotspots by CPU Utilization
Window: Summary - HPC Performance Characterization
Window: Summary - Memory Consumption
Window: Summary - Memory Usage
Window: Summary - Platform Power Analysis
Average Time
Computing Threads Started
Computing Threads Started, Threads/sec
CPU Time
EU 2 FPU Pipelines Active
EU Array Active
EU Array Idle
EU Array Stalled/Idle
EU Array Stalled
EU IPC Rate
EU Send pipeline active
EU Threads Occupancy
Global
GPU EU Array Usage
GPU L3 Bound
GPU L3 Miss Ratio
GPU L3 Misses
GPU L3 Misses, Misses/sec
GPU Memory Read Bandwidth, GB/sec
GPU Memory Texture Read Bandwidth, GB/sec
GPU Memory Write Bandwidth, GB/sec
GPU Texel Quads Count, Count/sec
GPU Utilization
Instance Count
L3 Sampler Bandwidth, GB/sec
L3 Shader Bandwidth, GB/sec
LLC Miss Rate due GPU Lookups
LLC Miss Ratio due GPU Lookups
Local
Maximum GPU Utilization
Occupancy
PS EU Active %
PS EU Stall %
Ratio to Max Bandwidth, %
Ratio to Max Bandwidth, %
Ratio to Max Bandwidth, %
Render/GPGPU Command Streamer Loaded
Samples Blended
Samples Killed in PS, pixels
Samples Written
Sampler Busy
Sampler Is Bottleneck
Shared Local Memory Read Bandwidth, GB/sec
Shared Local Memory Write Bandwidth, GB/sec
SIMD Width
Size
Total, GB/sec
Total Time
Typed Memory Read Bandwidth, GB/sec
Typed Memory Write Bandwidth, GB/sec
Typed Reads Coalescence
Typed Writes Coalescence
Untyped Memory Read Bandwidth, GB/sec
Untyped Memory Write Bandwidth, GB/sec
Untyped Reads Coalescence
Untyped Writes Coalescence
VS EU Active
VS EU Stall
Visible to Intel only — GUID: GUID-83549642-0E54-4173-8095-3DDC94BB84B4
Analyze Linux Kernel I/O
Use the Input and Output analysis of Intel® VTune™ Profiler to match user-level code to I/O operations executed by the hardware.
This collection mode uses hardware event-based sampling collection and system-wide Ftrace* collection to provide a consistent view of the storage system combined with hardware events, as well as an easy-to-use method to match user-level source code to I/O operations executed by the hardware.
NOTE:
This analysis actively relies on the data provided by the kernel block driver sub-system. If your platform utilizes a non-standard block driver sub-system, such as in the case of using user-space storage drivers, I/O metrics will not be available in this analysis type.
VTune Profiler provides the following system-wide metrics for the kernel I/O analysis:
I/O Wait — this system-wide metric represents the amount of time during which the CPU cores were idle due to threads being in an I/O wait state.
I/O Queue Depth — this metric shows the number of I/O requests submitted to the storage device. If the number of requests in a queue is zero, this means that there are no requests scheduled, and the disk is not utilized at all.
I/O Data Transfer — this metric shows the number of bytes read from or written to the storage device(s).
Page Faults — this metric shows the number of page faults that have occurred on the system. It is particularly useful when analyzing access to memory-mapped files.
CPU Activity — this metric represents the portion of time the system spent in one of the following states:
Idle state — the CPU core is idle
Active state — the CPU core is executing a thread
I/O Wait — the CPU core is idle, but there is a thread that could potentially be executed on this core that is blocked by disk access.
All I/O metrics collected by VTune Profiler, such as I/O Wait Time, I/O Waits, and I/O Queue Depth, are collected in a system-wide mode and are not target-specific.
Analyze I/O Wait Time
To analyze I/O Wait Time, start with the Summary window. This window provides a quick overview of the target system performance and introduces the I/O Wait Time metric that helps you identify whether your application is I/O-bound:
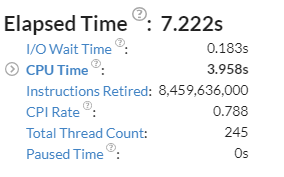
The I/O Wait Time metric represents a portion of time during which the threads are in I/O wait state while the system has cores in idle state. In this case, the number of threads is not greater than the number of idling cores. This aggregated I/O Wait Time metric is an integral function of the I/O Wait metric that is available in the Timeline pane of the Bottom-up window.
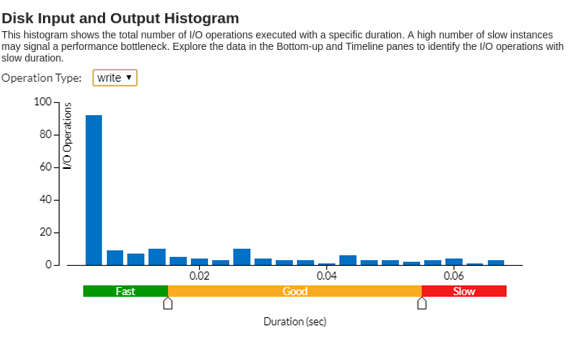
To estimate how quickly storage requests are served by the kernel sub-system, see the Disk Input and Output Histogram. Use the Operation Type drop-down menu to select the type of I/O operation you are interested in. For example, for I/O writes, 2-4 storage requests executed within 0.06 seconds or more are classified as slow by VTune Profiler:
To explore this type of I/O request in greater detail, switch to the Bottom-up window.
Analyze Slow I/O Requests
In the Bottom-up window, select an area of interest on the timeline, then use the Zoom In and Filter by Selection context menu option. The Summary histogram is updated to show the data for the selected time range.
For example, in this case, there were 2-4 slow write requests executed during the 6th second of application execution:
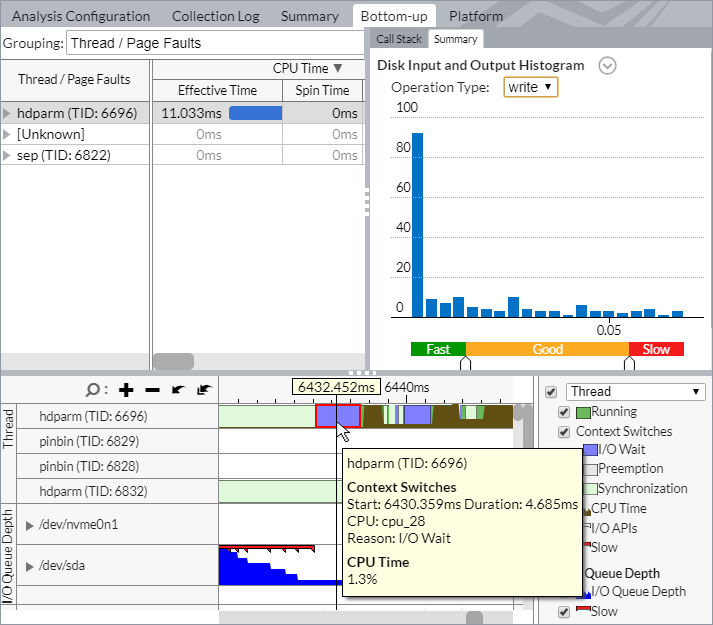
By zooming in on an area of interest, you can get a closer look at different metrics and understand the reason behind high I/O wait time.
VTune Profiler collects the I/O Wait type of context switches caused by I/O accesses from the thread, and provides a system-wide I/O Wait metric in the CPU Activity area. Use this data to identify imbalance between I/O and compute operations.
System-wide I/O Wait shows the time during which the system cores were idle, but there were threads in a context switch due to I/O access. Use this metric to estimate the dependency of performance on the storage medium.
For example, an I/O Wait value of 100% means that all cores of the system are idle, but there are threads blocked by I/O requests. To solve this issue, change the logic of the application to run compute threads in parallel with I/O tasks. Alternatively, consider using faster storage.
An I/O Wait value of 0% could mean one of the following:
Regardless of the number of threads blocked on storage access, all CPU cores are actively executing application code.
No threads are blocked on storage access.
Explore the I/O Queue Depth area to see thee number of storage requests submitted to the storage device. Spikes correspond to the maximum number of requests. Zero-value gaps on the I/O Queue Depth chart correspond to points in application run when storage was not utilized at all.
To identify the exact points in time when slow I/O packets were scheduled for execution, enable the Slow markers for the I/O Queue Depth metric:
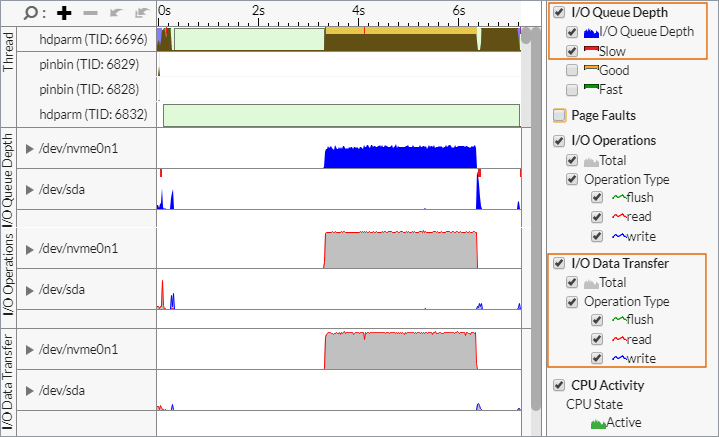
To identify points of high bandwidth, analyze the I/O Data Transfer area that shows thee number of bytes read from or written to the storage device.
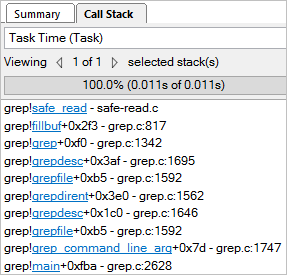
Analyze Call Stack for I/O Functions
VTune Profiler instruments all user-space I/O functions. This enables you to correlate slow I/O requests with instrumented user-space activities. You can do that by examining the full call stack that points to the exact API invocation.
To view a Task Time call stack for a particular I/O call, select the required I/O API marker on the timeline and explore the stack in the Call Stack pane:
Parent topic: Input and Output Analysis