Visible to Intel only — GUID: GUID-8428387F-F4DA-4DB7-8A6A-193056E082E1
Prepare Application for Analysis
Windows* Targets
Linux* Targets
Embedded Linux* Targets
FreeBSD* Targets
QNX* Targets
Managed Code Targets
Android* Targets
Intel® Xeon Phi™ Processor Targets
Targets in Virtualized Environments
Targets in a Cloud Environment
Arbitrary Targets
Embedded System Targets
Build and Install the Sampling Drivers for Linux* Targets
Debug Information for Linux* Application Binaries
Compiler Switches for Performance Analysis on Linux* Targets
Enable Linux* Kernel Analysis
Resolution of Symbol Names for Linux-Loadable Kernel Modules
Analyze Statically Linked Binaries on Linux* Targets
Set Up Remote Linux* Target
User-Mode Sampling and Tracing Collection
Hardware Event-based Sampling Collection
Performance Snapshot
Algorithm Group
Microarchitecture Analysis Group
Parallelism Analysis Group
Input and Output Analysis
Accelerators Analysis Group
Platform Analysis Group
Hybrid CPU Analysis
Source Code Analysis
Custom Analysis
Energy Analysis
Code Profiling Scenarios
Control Data Collection
Manage Data Views
Manage Result Files
Switch Viewpoints
Control Window Synchronization
View Stacks
Manage Grid Views
Manage Timeline View
Change Threshold Values
Choose Data Format
Group and Filter Data
View Data on Inline Functions
Analyze Loops
Stitch Stacks for Intel® oneAPI Threading Building Blocks or OpenMP* Analysis
Search for Data
performance-snapshot Command Line Analysis
hotspots Command Line Analysis
anomaly-detection Command Line Analysis
threading Command Line Analysis
memory-consumption Command Line Analysis
hpc-performance Command Line Analysis
uarch-exploration Command Line Analysis
memory-access Command Line Analysis
tsx-exploration Command Line Analysis
tsx-hotspots Command Line Analysis
sgx-hotspots Command Line Analysis
gpu-hotspots Command Line Analysis
gpu-offload Command Line Analysis
graphics-rendering Command Line Analysis
fpga-interaction Command Line Analysis
io Command Line Analysis
system-overview Command Line Analysis
platform-profiler Command Line Analysis
runsa/runss Custom Command Line Analysis
Configure Analysis Options from Command Line
Collect System-Wide Data from Command Line
Collect Data on Remote Linux* Systems from Command Line
Configure GPU Analysis from Command Line
Specify Search Directories from Command Line
Specify Result Directory from Command Line
Pause Collection from Command Line
Manage Analysis Duration from Command Line
Limit Data Collection from Command Line
Option Descriptions and General Rules
allow-multiple-runs
analyze-kvm-guest
analyze-system
app-working-dir
call-stack-mode
collect
collect-with
column
command
cpu-mask
csv-delimiter
cumulative-threshold-percent
custom-collector
data-limit
discard-raw-data
duration
filter
finalization-mode
finalize
format
group-by
help
import
inline-mode
knob
kvm-guest-kallsyms
kvm-guest-modules
limit
loop-mode
mrte-mode
no-follow-child
no-summary
no-unplugged-mode
quiet
report
report-knob
report-output
report-width
result-dir
resume-after
return-app-exitcode
ring-buffer
search-dir
show-as
sort-asc
sort-desc
source-object
source-search-dir
stack-size
start-paused
strategy
target-install-dir
target-system
target-tmp-dir
target-duration-type
target-pid
target-process
time-filter
trace-mpi
user-data-dir
verbose
version
Best Practices: Resolve Intel® VTune™ Profiler BSODs, Crashes, and Hangs in Windows* OS
Error Message: Application Sets Its Own Handler for Signal
Error Message: Cannot Enable Event-Based Sampling Collection
Error Message: Cannot Collect GPU Hardware Metrics
Error Message: Cannot Collect GPU Hardware Metrics for the Selected GPU Adapter
Error Message: Cannot Load Data File
Error Message: Cannot Locate Debugging Information
Error Message: Cannot Open Data
Error Message: Client Is Not Authorized to Connect to Server
Error Message: Root Privileges Required for Processor Graphics Events
Error Message: No Pre-built Driver Exists for This System
Error Message: Not All OpenCL™ API Profiling Callbacks Are Received
Error Message: Problem Accessing the Sampling Driver
Error Message: Required Key Not Available
Error Message: Scope of ptrace System Call Is Limited
Error Message: Stack Size Is Too Small
Error Message: Symbol File Is Not Found
Problem: Analysis of the .NET* Application Fails
Problem: Cannot Access VTune Profiler Documentation
Problem: CPU time for Hotspots or Threading Analysis is Too Low
Problem: 'Events= Sample After Value (SAV) * Samples' Is Not True If Multiple Runs Are Disabled
Problem: Guessed Stack Frames
Problem: GUI Hangs or Crashes
Problem: Inaccurate Sum in the Grid
Problem: Information Collected via ITT API Is Not Available When Attaching to a Process
Problem: No GPU Utilization Data Is Collected
Problem: Same Functions Are Compared As Different Instances
Problem: Skipped Stack Frames
Problem: Stack in the Top-Down Tree Window Is Incorrect
Problem: Stacks in Call Stack and Bottom-Up Panes Are Different
Problem: System Functions Appear in the User Functions Only Mode
Problem: VTune Profiler is Slow to Respond When Collecting or Displaying Data
Problem: VTune Profiler is Slow on X-Servers with SSH Connection
Problem: Unexpected Paused Time
Problem: {Unknown Timer} in the Platform Power Analysis Viewpoint
Problem: Unknown Critical Error Due to Disabled Loopback Interface
Problem: Unknown Frames
Problem: Unreadable Text on macOS*
Problem: Unsupported Microsoft* Windows* OS
Warnings about Accurate CPU Time Collection
Context Menu: Grid
Context Menus: Call Stack Pane
Context Menus: Project Navigator
Context Menus: Source/Assembly Window
Dialog Box: Binary/Symbol Search
Dialog Box: Source Search
Hot Keys
Menu: Customize Grouping
Menu: Intel VTune Profiler
Pane: Call Stack
Pane: Options - General
Pane: Options - Result Location
Pane: Options - Source/Assembly
Project Navigator
Pane: Timeline
Toolbar: Configure Analysis
Toolbar: Filter
Toolbar: Source/Assembly
Toolbar: Intel VTune Profiler
Window: Bandwidth - Platform Power Analysis
Window: Bottom-up
Window: Caller/Callee
Window: Cannot Find <file type> File
Window: Collection Log
Window: Compare Results
Window: Configure Analysis
Window: Core Wake-ups - Platform Power Analysis
Window: Correlate Metrics - Platform Power Analysis
Window: CPU C/P States - Platform Power Analysis
Window: Debug
Window: Event Count - Hardware Events
Window: Flame Graph
Window: Graphics - GPU Compute/Media Hotspots
Window: Graphics C/P States - Platform Power Analysis
Window: NC Device States - Platform Power Analysis
Window: Platform
Window: Platform Power Analysis
Window: Sample Count - Hardware Events
Window: SC Device States - Platform Power Analysis
Window: Summary
Window: System Sleep States - Platform Power Analysis
Window: Temperature/Thermal Sample - Platform Power Analysis
Window: Timer Resolution - Platform Power Analysis
Window: Top-down Tree
Window: Uncore Event Count - Hardware Events
Window: Wakelocks - Platform Power Analysis
Window: Summary - Input and Output Summary
Window: Summary - Microarchitecture Exploration
Window: Summary - GPU Analysis
Window: Summary - Hardware Events
Window: Summary - Hotspots by CPU Utilization
Window: Summary - HPC Performance Characterization
Window: Summary - Memory Consumption
Window: Summary - Memory Usage
Window: Summary - Platform Power Analysis
Average Time
Computing Threads Started
Computing Threads Started, Threads/sec
CPU Time
EU 2 FPU Pipelines Active
EU Array Active
EU Array Idle
EU Array Stalled/Idle
EU Array Stalled
EU IPC Rate
EU Send pipeline active
EU Threads Occupancy
Global
GPU EU Array Usage
GPU L3 Bound
GPU L3 Miss Ratio
GPU L3 Misses
GPU L3 Misses, Misses/sec
GPU Memory Read Bandwidth, GB/sec
GPU Memory Texture Read Bandwidth, GB/sec
GPU Memory Write Bandwidth, GB/sec
GPU Texel Quads Count, Count/sec
GPU Utilization
Instance Count
L3 Sampler Bandwidth, GB/sec
L3 Shader Bandwidth, GB/sec
LLC Miss Rate due GPU Lookups
LLC Miss Ratio due GPU Lookups
Local
Maximum GPU Utilization
Occupancy
PS EU Active %
PS EU Stall %
Ratio to Max Bandwidth, %
Ratio to Max Bandwidth, %
Ratio to Max Bandwidth, %
Render/GPGPU Command Streamer Loaded
Samples Blended
Samples Killed in PS, pixels
Samples Written
Sampler Busy
Sampler Is Bottleneck
Shared Local Memory Read Bandwidth, GB/sec
Shared Local Memory Write Bandwidth, GB/sec
SIMD Width
Size
Total, GB/sec
Total Time
Typed Memory Read Bandwidth, GB/sec
Typed Memory Write Bandwidth, GB/sec
Typed Reads Coalescence
Typed Writes Coalescence
Untyped Memory Read Bandwidth, GB/sec
Untyped Memory Write Bandwidth, GB/sec
Untyped Reads Coalescence
Untyped Writes Coalescence
VS EU Active
VS EU Stall
Visible to Intel only — GUID: GUID-8428387F-F4DA-4DB7-8A6A-193056E082E1
Hotspots View
Identify program units that took the most CPU time. These are recognized as hotspots. The Hotspots viewpoint is available for all analysis results.
Follow these steps to interpret performance data available in the Hotspots viewpoint:
Define a Performance Baseline
Start your analysis in the Summary window. Here you see general information about the execution of your application. Note that the Elapsed time is different from the application CPU time. The Elapsed time is the application time from start to termination. The application CPU time is the sum of the active processor time for all the threads that run the application. It does not include waiting times.
Use the Elapsed time value as a baseline to compare versions before and after optimization. When tuning the application, as you add more threads, the Elapsed time tends to decrease whereas the CPU time may increase.
If you ran the Hotspots analysis in the hardware event-based sampling mode, the analysis metrics in the Summary window display the Microarchitecture Usage metric. Use this metric to estimate the code efficiency on your hardware platform:
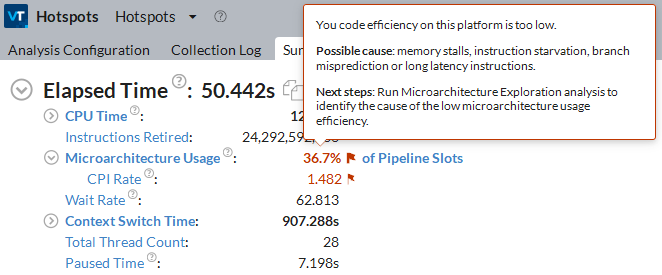
If this metric value is flagged as critical, consider running the Microarchitecture Exploration analysis to dive deeper into hardware metrics.
Identify the Hottest Function
Get a list of the most time-consuming functions in the Top Hotspots section of the Summary window. Click on a hotspot function to explore its call flow and other related metrics in the Bottom-up view.
By default, the Bottom-up view presents a sorted display of CPU Time in descending order, starting with the most time-consuming functions. Start optimizing the functions with the largest CPU time.
Expand the CPU Time column to get more details on how effectively the CPU time was used:
Next, focus your tuning efforts on the program units with the largest Poor value. This means that your application underutilized the CPU time during the execution of these program units. The overall goal of optimization is to achieve Ideal (green ![]() ) or OK (orange
) or OK (orange ![]() ) CPU utilization state and shorten the Poor and Over CPU utilization values.
) CPU utilization state and shorten the Poor and Over CPU utilization values.
Identify Hot Code Paths
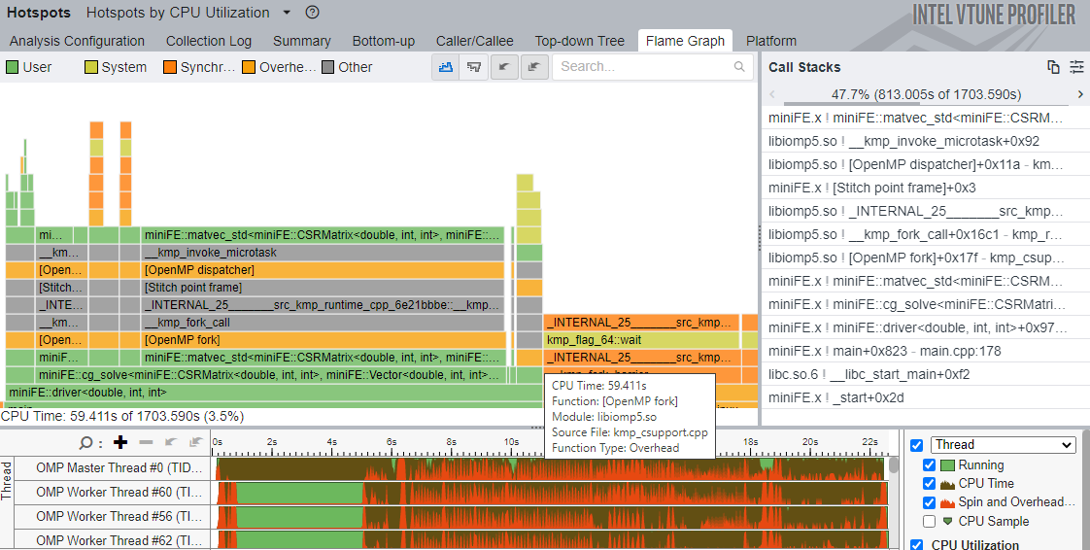
Switch to the Flame Graph window to quickly identify the hottest code paths in your application. Analyze the CPU time spent on each program unit and its related callee functions.
The flame graph plots stack profile population (sorted alphabetically) on the horizontal axis. The vertical axis shows stack depth, starting from zero at the bottom. The width of each element in the flame graph indicates the percentage of CPU time of the function (and its callees) to the total CPU time.
Identify Algorithm Issues
If you identify issues with the calling sequences in your application, you can improve performance by revising the order in which functions are called. Use these methods:
Top-down Tree pane: Analyze the Total and Self time data for callers and callees of the hotspot function to understand whether this time can be optimized.
Call Stack pane: Identify the highest contributing stack for the program unit(s) selected in the Bottom-up or Top-down Tree panes. Use the navigation buttons
 to see the different stacks that called the selected program unit(s). The contribution bar shows the contribution of the currently visible stack to the overall time spent by the selected program unit(s). You can also use the drop-down list in the Call Stack pane to view data for different types of stacks.
NOTE:
Stack data is available by default for the user-mode sampling mode. To have this data for the hardware event-based sampling mode, you need to enable the Collect stacks option in the Hotspots analysis configuration.
Analyze Source
Double-click the hottest function to view its related source code in the Source/Assembly window. Open the code editor directly from Intel® VTune™ Profiler and improve your code (for example, minimizing the number of calls to the hotspot function).
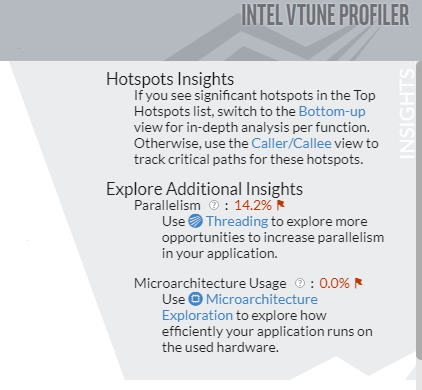
What's Next
If you ran the analysis with the default Show additional performance insights option, the Summary view will include the Insights section that provides additional metrics for your target such as efficiency of the hardware usage and vectorization. This information helps you identify potential next steps for your performance analysis and understand where you could focus your optimization efforts.
Related information
Parent topic: Hotspots Analysis for CPU Usage Issues