OpenMP* Imbalance and Scheduling Overhead
This recipe shows how to detect and fix frequent parallel bottlenecks of OpenMP programs such as imbalance on barriers and scheduling overhead.
Content expert: Dmitry Prohorov
A barrier is a synchronization point when execution is allowed after all threads in the thread team have come to the barrier. If the execution work is irregular and the chunks of work are equally and statically distributed by worker threads then the threads that already have come to a barrier start waiting for others wasting time rather than doing useful work. Aggregated wait time on a barrier normalized by the number of threads in the team shows elapsed time that the application can reduce if the imbalance is eliminated.
One of the options to eliminate the imbalance on a barrier is using the dynamic scheduling to have chunks of work distributed dynamically between threads. But if you do this with fine-grain chunks, the situation can be even worse because of the scheduling overhead. Consider following this recipe to learn a possible workflow to address issues with the OpenMP load imbalance and scheduling overhead using the Intel® VTune™ Amplifier.
Ingredients
This section lists the hardware and software tools used for the performance analysis scenario.
Application: an application calculating prime numbers in a particular range. The main loop is parallelized with the OpenMP parallel for construct.
Compiler: Intel Compiler version later than 13 Update 5. This recipe relies on this compiler version to have necessary instrumentation inside Intel OpenMP runtime library used by the VTune Amplifier for analysis. Intel Compiler option parallel-source-info=2 added for compilation provides source file information in OpenMP region names, which makes their identification easier for a user.
Performance analysis tools:
Intel VTune Amplifier 2018: HPC Performance Characterization analysis
NOTE:Starting with the 2020 release, Intel® VTune™ Amplifier has been renamed to Intel® VTune™ Profiler.
Most recipes in the Intel® VTune™ Profiler Performance Analysis Cookbook are flexible. You can apply them to different versions of Intel® VTune™ Profiler. In some cases, minor adjustments may be required.
Get the latest version of Intel® VTune™ Profiler:
From the Intel® VTune™ Profiler product page.
Download the latest standalone package from the Intel® oneAPI standalone components page.
Operating system: Linux*, Ubuntu 16.04 LTS
CPU: Intel Xeon® CPU E5-2699 v4 @ 2.20GHz
Create a Baseline
The initial version of the sample code uses the OpenMP parallel for pragma for the loop by numbers with the default scheduling that implies static (line 21):
#include <stdio.h>
#include <omp.h>

#define NUM 100000000

int isprime( int x )
{
    for( int y = 2; y * y <= x; y++ )
    {
        if( x % y == 0 )
            return 0;
    }

    return 1;
}

int main( )
{
    int sum = 0;

#pragma omp parallel for reduction (+:sum)
    for( int i = 2; i <= NUM ; i++ )
    {
        sum += isprime ( i );
    }

    printf( "Number of primes numbers: %d", sum );

    return 0;
}
Running the compiled application takes about 3.9 seconds. This is a performance baseline that could be used for further optimizations.
Run HPC Performance Characterization Analysis
To have a high-level understanding of potential performance bottlenecks for the sample, start with the HPC Performance Characterization analysis provided by the VTune Amplfier:
Click the
 New Project button on the toolbar and specify a name for the new project, for example: primes.
 Click Create Project.
The Configure Analysis window opens.
On the WHERE pane, select the Local Host target system type.
On the WHAT pane, select the Launch Application target type and specify an application for analysis. For example:
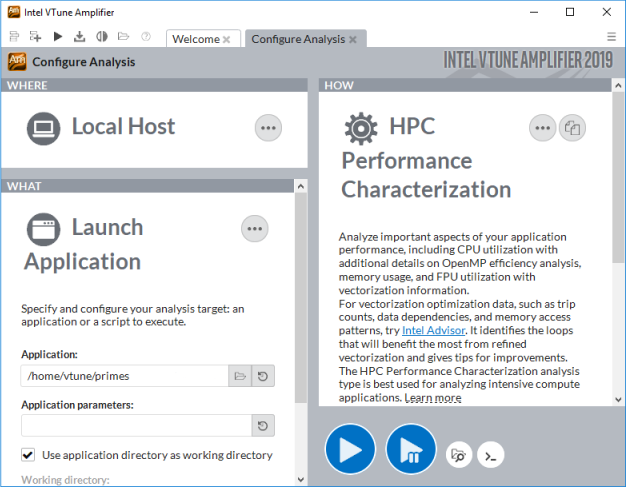
On the HOW pane, click the browse button and select HPC Performance Characterization from the Parallelism group.
Click the
 Start button.
VTune Amplifier launches the application, collects data, finalizes the data collection result resolving symbol information, which is required for successful source analysis.
Identify OpenMP Imbalance
HPC Performance Characterization analysis collects and shows important HPC metrics that help understand such performance bottlenecks as CPU utilization (parallelism), memory access efficiency and vectorization. For applications run with the Intel OpenMP runtime, as in this recipe, you can benefit from special OpenMP efficiency metrics that help identify issues with threading parallelism.
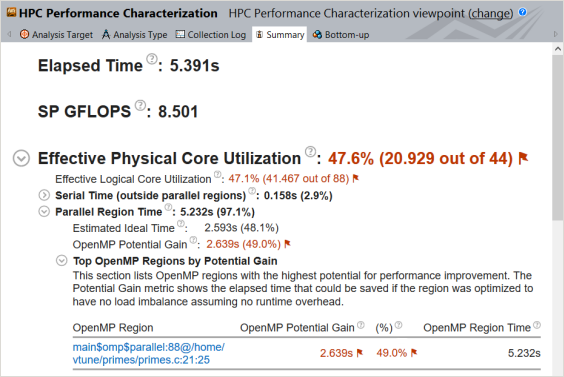
Start your analysis with the Summary view that displays application-level statistics. Flagged Effective Physical Core Utilization metric (on some systems just CPU Utilization) signals a performance problem that should be explored:
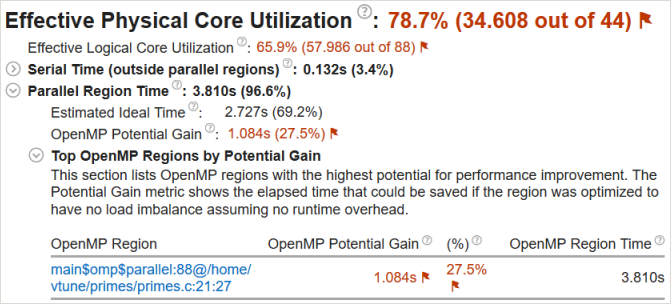
Move to the Parallel Region Time > OpenMP Potential Gain metric to estimate the maximum potential gain that you can get eliminating parallel inefficiencies. The value of 1.084s (equal to 27.5% of the application runtime) for this sample is flagged, so it is worth to explore the breakdown by parallel constructs.
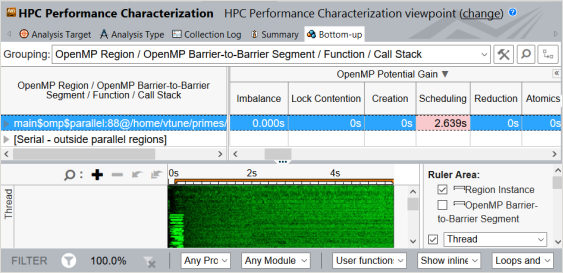
In the sample application, there is one parallel construct provided in the Top OpenMP Regions section. Click the region name in the table to explore more details in the Bottom-up view. Expand the OpenMP Potential Gain column in the Bottom-up grid to see the breakdown by inefficiencies. This data helps you understand why the processor time was spent in the OpenMP runtime rather than in your application and how it impacts the elapsed time:
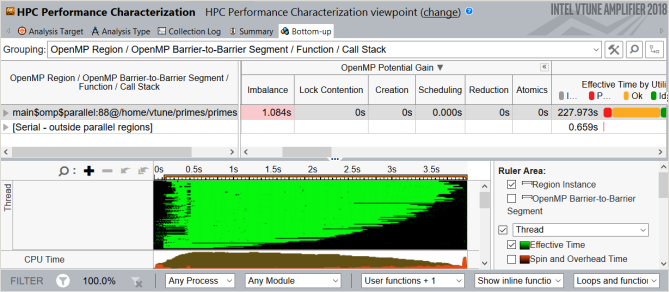
The hot region in the grid row has a highlighted value for the Imbalance metric. Mouse over this value to see a hint that recommends trying the dynamic scheduling to eliminate the imbalance. Note that if you have more than one barrier in a region you need to expand the region node by barrier-to-barrier segments and identify a performance-critical barrier:
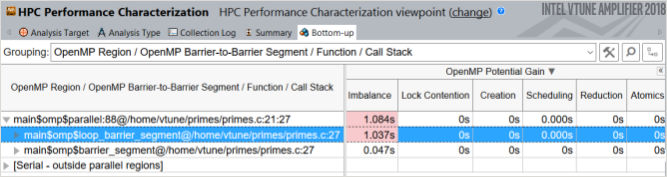
In this sample, there is a loop barrier with critical imbalance and a parallel region join barrier that is not classified by the VTune Amplifier as a bottleneck.
NOTE:
To better visualize the imbalance during the application run, explore the Timeline view. Useful work shows up in green while the black color marks the time waste.
Apply Dynamic Scheduling
The imbalance could be caused by static work distribution and assigning large numbers to particular threads while some of the threads processed their chunks with small numbers quickly and wasted the time on the barrier. To eliminate this imbalance, apply dynamic scheduling with the default parameters:
    int sum = 0;

#pragma omp parallel for schedule(dynamic) reduction (+:sum)
    for( int i = 2; i <= NUM ; i++ )
    {
        sum += isprime ( i );
    }
Re-compile the application and compare the execution time versus the original performance baseline to verify your optimization.
Identify OpenMP Scheduling Overhead
Running the modified sample application does not result in any speedup but shows the execution time increased to 5.3 seconds. This is a possible side effect of applying dynamic scheduling with fine-grain chunks of work. To get more insights on possible bottlenecks, consider re-running the HPC Performance Characterization analysis to see the reasons of performance degradation:
From the product menu, select New > HPC Performance Characterization Analysis to open the analysis configuration for the existing project primes.
Click Start.
In the Summary view, the Effective Physical Core Utilization metric is flagged as performance critical and the Potential Gain value for the OpenMP region has increased versus the original value of 1.084s:
This data confirms that the parallel efficiency of the code has dropped. To understand the reason, switch to the Bottom-up view:
You see the Scheduling overhead even more severe than the imbalance in the previous analysis result. This is caused by the default behavior of the scheduler that assigns one loop iteration per a worker thread. Threads turn back to the scheduler quickly creating a bottleneck in the condition of high concurrency. Effective Time metric distribution on the timeline (in green) shows regular work by threads but with lower density. Hovering over the highlighted Scheduling metric value in the grid provides some performance advice to use chunking in OpenMP pragma parallel for to make parallel work more coarse-grain and eliminate the scheduling overhead.
Apply Dynamic Scheduling with a Chunk Parameter
Use the chunk parameter 20 for the schedule clause as follows:
#pragma omp parallel for schedule(dynamic,20) reduction (+:sum)
for( int i = 2; i <= NUM ; i++ )
{
sum += isprime ( i );
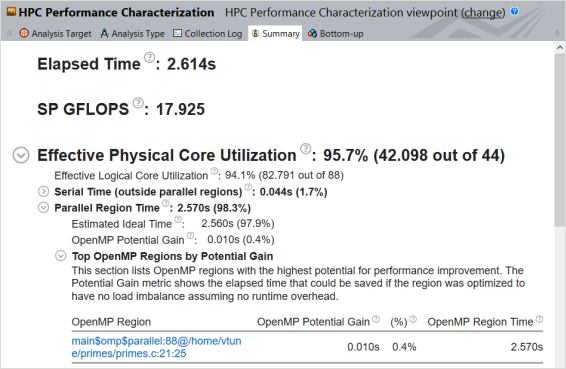
}After re-compilation, the application runs for 2.6 seconds, which improves the baseline by 30%. The Summary view shows the Parallel Region Time close to ideal - 98.3%:
The Bottom-up view shows good density of useful (green) work on the timeline:
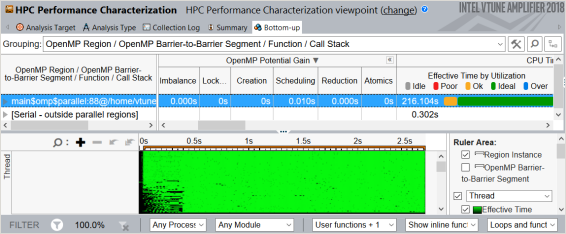
Dynamic scheduling may provoke a less cache-friendly code execution since a frequent assignment of new chunks of work to a thread can prevent it from effective cache reuse. So, a well-balanced optimized application with effective CPU utilization can run slower than an imbalanced one with static scheduling. Explore the Memory Bound section of the HPC Performance Characterization view for details if it happens.
NOTE:
To discuss this recipe, visit the developer forum.
Parent topic: Tuning Recipes