Visible to Intel only — GUID: GUID-586973BE-B1AC-4AA4-888F-ABA1AAA53C6F
Top-down Microarchitecture Analysis Method
OpenMP* Code Analysis Method
Software Optimization for Intel® GPUs (NEW)
Core Utilization in DPDK Apps
PCIe Traffic in DPDK Apps
DPDK Event Device Profiling
Effective Utilization of Intel® Data Direct I/O Technology
Compile a Portable Optimized Binary with the Latest Instruction Set
Analyzing Hot Code Paths Using Flame Graphs (NEW)
Improving Hotspot Observability in a C++ Application Using Flame Graphs
Profiling Games built with Unity* (NEW)
Profiling Games built with Unreal Engine* (NEW)
Profiling Java Applications as a Remote User (NEW)
Profiling JavaScript* Code in Node.js*
Measuring Performance Impact of NUMA in Multi-Processor Systems (NEW)
Analyzing CPU and FPGA (Intel® Arria® 10 GX) Interaction
Profiling a .NET* Core Application
Profiling Applications in Amazon Web Services* (AWS) EC2 Instances
Enabling Performance Profiling in GitLab* CI
Configuring a Hyper-V* Virtual Machine for Hardware-Based Hotspots Analysis
Profiling an Application for Performance Anomalies (NEW)
Profiling an OpenMP* Offload Application running on a GPU (NEW)
Profiling a SYCL* Application running on a GPU
Using the Command-Line Interface to Analyze the Performance of a SYCL* Application running on a GPU (NEW)
Profiling an FPGA-driven SYCL* Application
Profiling Hardware Without Intel Sampling Drivers
Profiling MPI Applications
Profiling Docker* Containers
Profiling a Remote Target Through a Proxy Server (NEW)
Using Intel® VTune™ Profiler Server with Visual Studio Code and Intel® DevCloud for oneAPI (NEW)
Using Intel® VTune™ Profiler Server in HPC Clusters
Profiling in a Singularity* Container
Profiling Linux*, Android*, and QNX* System Boot Time
Cache-Related Latency Issues in Segmented Cache Environment
False Sharing
Frequent DRAM Accesses
Poor Port Utilization
Page Faults
Instruction Cache Misses
Ingredients
Run General Exploration Analysis
Identify Hardware Hotspots
Re-compile Your Code with PGO
Verify Optimization
Inefficient Synchronization
Inefficient TCP/IP Synchronization
OS Thread Migration
OpenMP* Imbalance and Scheduling Overhead
Processor Cores Underutilization: OpenMP* Serial Time
Scheduling Overhead in Intel® Threading Building Blocks (Intel® TBB) Apps
PMDK Application Overhead
Visible to Intel only — GUID: GUID-586973BE-B1AC-4AA4-888F-ABA1AAA53C6F
Instruction Cache Misses
This recipe explores profiling a front-end-bound application using the General Exploration analysis of the Intel® VTune™ Amplifier and using a PGO option to reduce ICache misses.
Content expert: Dmitry Ryabtsev
DIRECTIONS:
NOTE:
General Exploration analysis was renamed to Microarchitecture Exploration analysis staring with Intel VTune Amplifier 2019.
Ingredients
This section lists the hardware and software tools used for the performance analysis scenario.
Application: a test sample based on sqlite database. The application is used as a demo and not available for download.
Tools:
Intel VTune Amplifier 2018: General Exploration analysis
NOTE:Starting with the 2020 release, Intel® VTune™ Amplifier has been renamed to Intel® VTune™ Profiler.
Most recipes in the Intel® VTune™ Profiler Performance Analysis Cookbook are flexible. You can apply them to different versions of Intel® VTune™ Profiler. In some cases, minor adjustments may be required.
Get the latest version of Intel® VTune™ Profiler:
From the Intel® VTune™ Profiler product page.
Download the latest standalone package from the Intel® oneAPI standalone components page.
Intel® C++ Compiler
Operating system: Microsoft* Windows* 7
CPU: Intel® microarchitecture code named Skylake
Run General Exploration Analysis
To have a high-level understanding of potential performance bottlenecks for the sample, start with the General Exploration analysis provided by the VTune Amplifier:
Click the
 New Project button on the toolbar and specify a name for the new project, for example: sqlite.
 In the Analysis Target window, select the local host target system type for the host-based analysis.
Select the Launch Application target type and specify an application for analysis on the right.
Click the Choose Analysis button on the right, select Microarchitecture Analysis > General Exploration and click Start.
VTune Amplifier launches the application, collects data, finalizes the data collection result resolving symbol information, which is required for successful source analysis.
Identify Hardware Hotspots
General Exploration analysis helps you see dominant performance bottlenecks in your code. Start your analysis with the Summary view that displays application-level statistics per hardware metrics. Focus on the flagged performance issues:
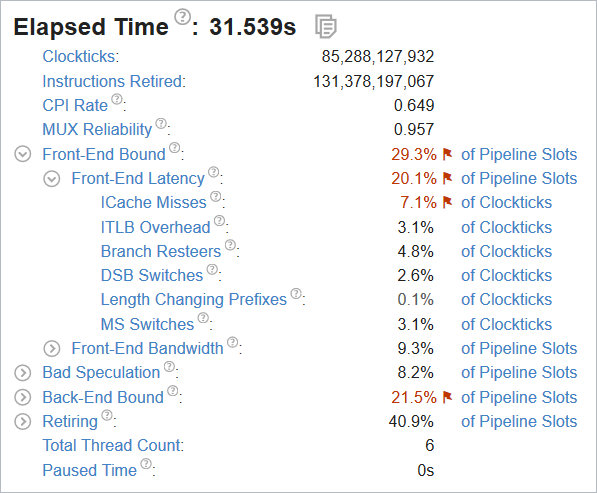
The sample application is front-end bound (29.3% of Pipeline Slots) with the instruction cache misses as a dominant bottleneck (7.1% of Clockticks).
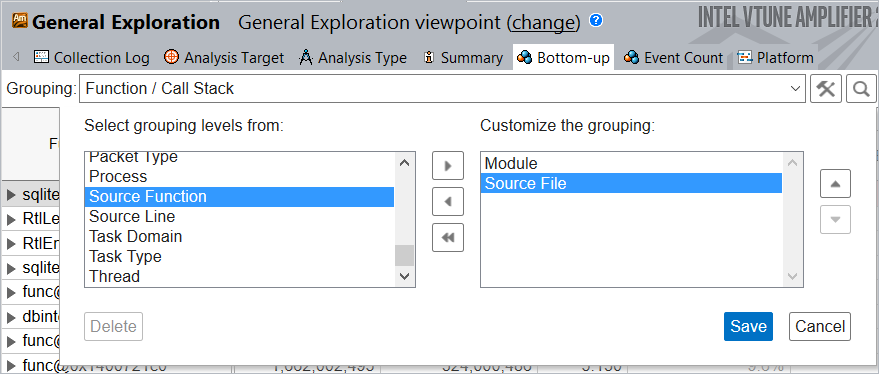
Switch to the Bottom-up tab to locate the issue in the code. Click the  Customize Grouping button next to the Grouping toolbar and create a new custom grouping Module/Source File:
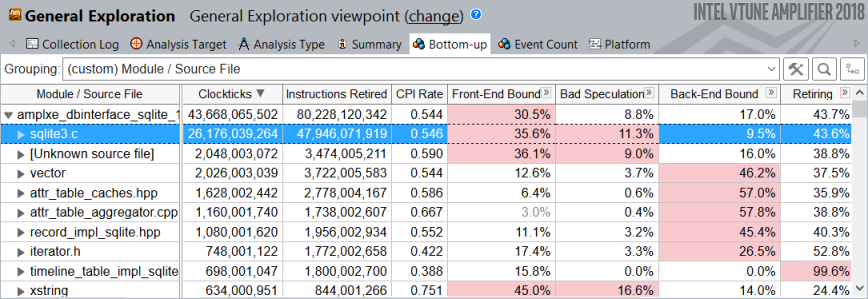
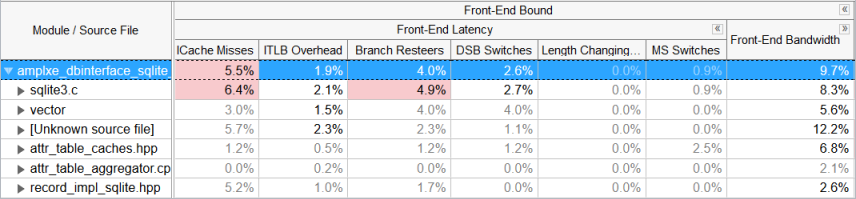
The new grouping applied to the collected results shows that sqlite3.c file is the main hotspot taking the most of CPU cycles to execute:
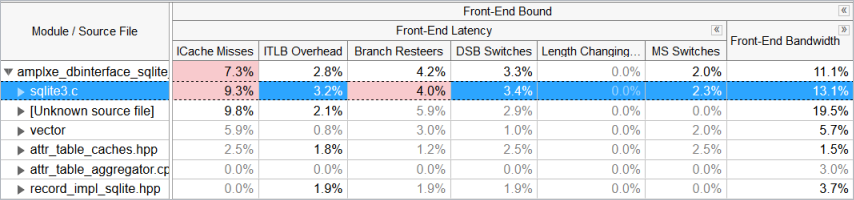
Navigating to the ICache Misses metric also discovers the highest value for the sqlite3.c file:
Re-compile Your Code with PGO
Use Intel® C++ Compiler to apply the Profile Guided Optimization (PGO) to the sqlite library:
Recompile your code with the /Qprof-gen option.
Run the benchmark.
Re-compile the code with the /Qprof-use option.
For more details, see the Profile-Guided Optimizations Overview.
Verify Optimization
Re-run the General Exploration analysis on the optimized code. The new result shows 30.3 seconds of Elapsed time, which is an almost 4% improvement to the original 31.5 seconds:
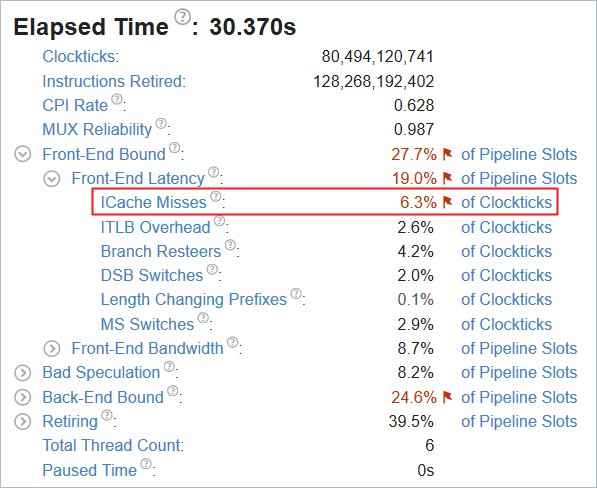
The number of clockticks stalled due to ICache Misses for the sqlite library has reduced to 6.4% from 9.3%:
Parent topic: Tuning Recipes