False Sharing
This recipe explores profiling a memory-bound linear_regression application using the General Exploration and Memory Access analyses of the Intel® VTune™ Amplifier.
Content expert: Dmitry Ryabtsev
DIRECTIONS:
NOTE:
General Exploration analysis is renamed to Microarchitecture Exploration analysis starting with Intel VTune Amplifier 2019.
Ingredients
This section lists the hardware and software tools used for the performance analysis scenario.
Application:linear_regression. The linear_regression.tgz sample package is available with the product in the <install-dir>/samples/en/C++ directory and at https://github.com/kozyraki/phoenix/tree/master/sample_apps/linear_regression.
Performance analysis tools:
Intel VTune Amplifier 2018: General Exploration, Memory Access analysis
NOTE:Starting with the 2020 release, Intel® VTune™ Amplifier has been renamed to Intel® VTune™ Profiler.
Most recipes in the Intel® VTune™ Profiler Performance Analysis Cookbook are flexible. You can apply them to different versions of Intel® VTune™ Profiler. In some cases, minor adjustments may be required.
Get the latest version of Intel® VTune™ Profiler:
From the Intel® VTune™ Profiler product page.
Download the latest standalone package from the Intel® oneAPI standalone components page.
Operating system: Linux*, Ubuntu* 16.04 64-bit
CPU: Intel® Core™ i7-6700K processor
Run General Exploration Analysis
To have a high-level understanding of potential performance bottlenecks for the sample, start with the General Exploration analysis provided by the VTune Amplifier:
Click the New Project button on the toolbar and specify a name for the new project, for example: linear_regression.
In the Analysis Target window, select the local host target system type for the host-based analysis.
Select the Launch Application target type and specify an application for analysis on the right.
Click the Choose Analysis button on the right, select Microarchitecture Analysis > General Exploration and click Start.
VTune Amplifier launches the application, collects data, finalizes the data collection result resolving symbol information, which is required for successful source analysis.
Identify a Bottleneck
Start with the Summary view that provides application-level statistics per hardware metrics.
Typically, for performance analysis you are recommended to create a baseline to measure your future optimizations. In this case, consider the application Elapsed Time as your baseline:
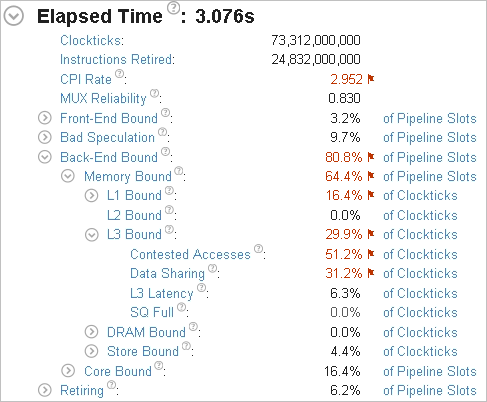
A brief analysis of the summary metrics shows that the application is mostly bound by contested memory accesses.
Find a Contended Data Structure
High value for the Contested Accesses metric prompts you to dig deeper and run the Memory Access analysis with the Analyze dynamic memory objects option enabled. This analysis helps you find out an access to what data structure caused contention issues:
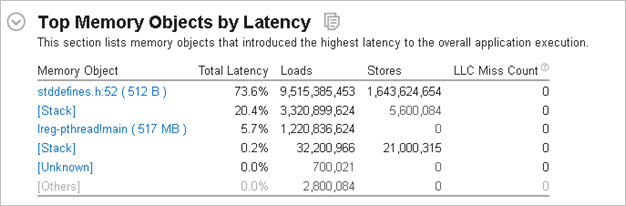
From the Summary view, you see that a memory allocation data object in file stddefines.h at line 52 introduced the highest latency to the application execution. The size of the allocation is quite small - only 512 bytes, so it should fit fully into the L1 cache. For more details, click this object in the table to switch to the Bottom-up view:
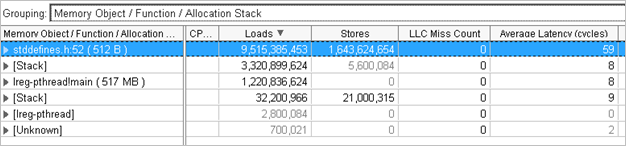
The average access latency to this object is 59 cycles, which is a very high value for the memory size that is expected to reside in the L1 cache. This can be the source for the contested accesses performance problem.
Expand the stddefines.h:52 (512B) memory object in the grid to view the allocation stack. Double-click the allocation stack to go deeper to the Source view that highlights the line where the object is allocated:
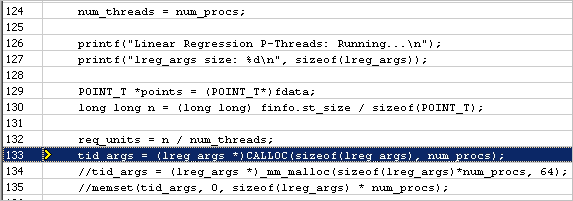
Where lreg_args is:
typedef struct
{
    pthread_t tid;
    POINT_T *points;
    int num_elems;
    long long SX;
    long long SY;
    long long SXX;
    long long SYY;
    long long SXY;
} lreg_args;
Threads code accessing the lreg_args array looks like this:
// ADD Up RESULTS
for (i = 0; i < args->num_elems; i++)
{
    //Compute SX, SY, SYY, SXX, SXY
    args->SX  += args->points[i].x;
    args->SXX += args->points[i].x*args->points[i].x;
    args->SY  += args->points[i].y;
    args->SYY += args->points[i].y*args->points[i].y;
    args->SXY += args->points[i].x*args->points[i].y;
}
Each thread is independently accessing its element in the array, which looks like false sharing.
The size of the lreg_args structure in the sample is 64 bytes, which matches the cacheline size. But when you allocate an array of these structures, there is no guarantee that this array will be aligned with 64 bytes. As a result, array elements may cross cacheline boundaries, which triggers an unintended contention issue - false sharing.
Fix False Sharing Issue
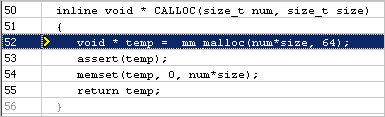
To fix this false sharing problem, switch to an _mm_malloc function, which is used to allocate memory with 64 bytes alignment:
Re-compiling and re-running the application analysis with VTune Profiler provides the following result:
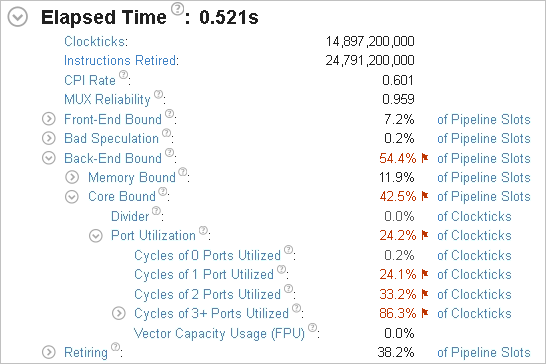
The Elapsed time is now 0.5 seconds, which is a significant improvement from original 3 seconds. The Memory Bound bottleneck went away. The false sharing performance issue is successfully fixed.
NOTE:
To discuss this recipe, visit the developer forum.
Parent topic: Tuning Recipes