Visible to Intel only — GUID: GUID-14D2220E-D169-4570-A13E-CCF1F18B2801
Top-down Microarchitecture Analysis Method
OpenMP* Code Analysis Method
Software Optimization for Intel® GPUs (NEW)
Core Utilization in DPDK Apps
PCIe Traffic in DPDK Apps
DPDK Event Device Profiling
Effective Utilization of Intel® Data Direct I/O Technology
Compile a Portable Optimized Binary with the Latest Instruction Set
Analyzing Hot Code Paths Using Flame Graphs (NEW)
Improving Hotspot Observability in a C++ Application Using Flame Graphs
Profiling Games built with Unity* (NEW)
Profiling Games built with Unreal Engine* (NEW)
Profiling Java Applications as a Remote User (NEW)
Profiling JavaScript* Code in Node.js*
Measuring Performance Impact of NUMA in Multi-Processor Systems (NEW)
Ingredients
Run Platform Profiler Analysis
Identify NUMA Issues
Set Thread CPU Affinity to Fix NUMA Issues
Verify NUMA Optimizations
Analyzing CPU and FPGA (Intel® Arria® 10 GX) Interaction
Profiling a .NET* Core Application
Profiling Applications in Amazon Web Services* (AWS) EC2 Instances
Enabling Performance Profiling in GitLab* CI
Configuring a Hyper-V* Virtual Machine for Hardware-Based Hotspots Analysis
Profiling an Application for Performance Anomalies (NEW)
Profiling an OpenMP* Offload Application running on a GPU (NEW)
Profiling a SYCL* Application running on a GPU
Using the Command-Line Interface to Analyze the Performance of a SYCL* Application running on a GPU (NEW)
Profiling an FPGA-driven SYCL* Application
Profiling Hardware Without Intel Sampling Drivers
Profiling MPI Applications
Profiling Docker* Containers
Profiling a Remote Target Through a Proxy Server (NEW)
Using Intel® VTune™ Profiler Server with Visual Studio Code and Intel® DevCloud for oneAPI (NEW)
Using Intel® VTune™ Profiler Server in HPC Clusters
Profiling in a Singularity* Container
Profiling Linux*, Android*, and QNX* System Boot Time
Cache-Related Latency Issues in Segmented Cache Environment
False Sharing
Frequent DRAM Accesses
Poor Port Utilization
Page Faults
Instruction Cache Misses
Inefficient Synchronization
Inefficient TCP/IP Synchronization
OS Thread Migration
OpenMP* Imbalance and Scheduling Overhead
Processor Cores Underutilization: OpenMP* Serial Time
Scheduling Overhead in Intel® Threading Building Blocks (Intel® TBB) Apps
PMDK Application Overhead
Visible to Intel only — GUID: GUID-14D2220E-D169-4570-A13E-CCF1F18B2801
Measuring Performance Impact of NUMA in Multi-Processor Systems (NEW)
Use this recipe to measure the performance impact of non-uniform memory access (NUMA) in multi-processor systems. This recipe uses the Platform Profiler analysis type in Intel® VTune™ Profiler.
Content expert: Jeffrey Reinemann, Asaf Yaffe
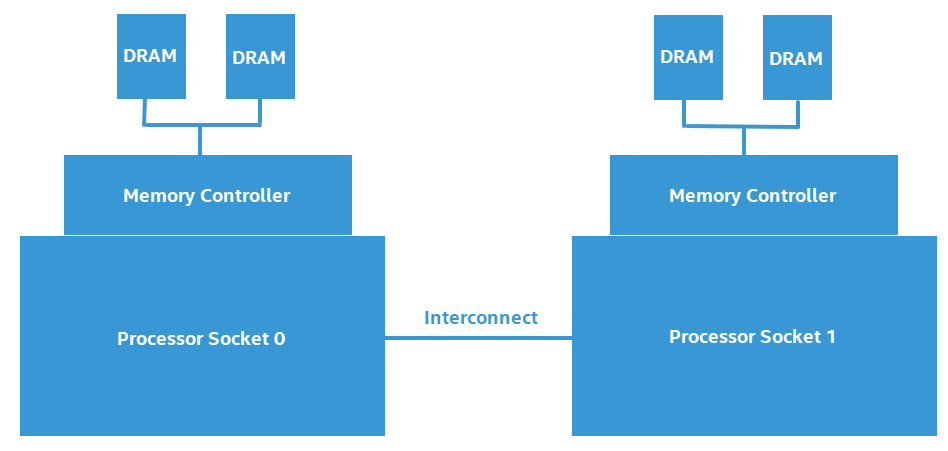
Non-uniform memory access (NUMA) is a computer memory design where the time for memory access depends on the location of memory relative to the processor. In NUMA, processor cores can access local memory (where the memory connected to the processor) faster than non-local memory (where the is memory connected to another processor or shared between processors).
This figure illustrates the design of a two-processor NUMA system.
Software that frequently accesses non-local (or remote) memory can suffer a measurable negative performance impact when compared to software that primarily accesses local memory. In this recipe, we look at measuring the negative performance impact of a NUMA system.
Ingredients
This section lists the hardware and software tools used in this scenario.
Application: The sample application used in this recipe is not available for download.
Tool: VTune Profiler version 2021.5.0 or newer
Run Platform Profiler Analysis
- Create a project.
- On the Welcome screen of VTune Profiler, click Configure Analysis.
- In the Analysis Tree, select the Platform Profiler analysis type in the Platform Analyses group.
- In the WHAT pane, select Profile System. If necessary, set limits on size and time for data collection in the Advanced section.
- Click the Start button to run the analysis. At any time before the collection completes, you can click the Stop button to terminate data collection and view results.
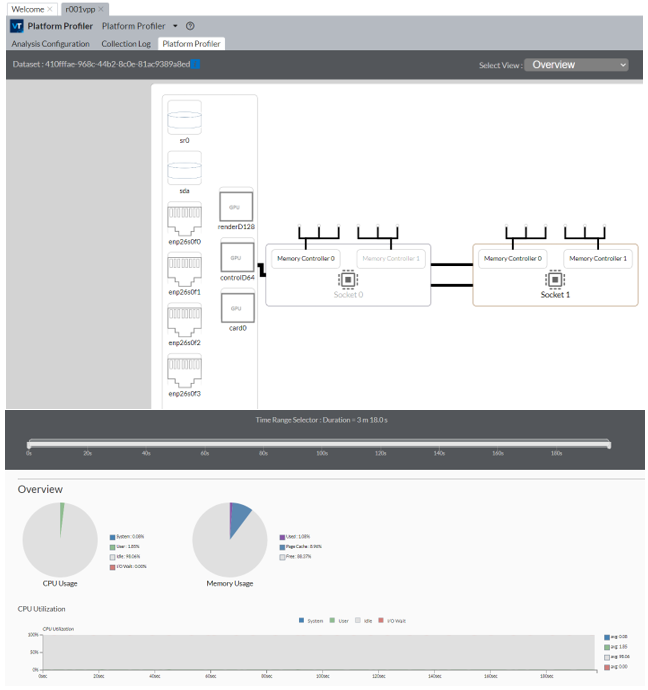
When the data collection completes, VTune Profiler finalizes the data and displays results in the Platform Profiler tab. Information in this tab is contained in three sections:
- Platform diagram
- Interactive time line
- Performance data charts
Identify NUMA Issues
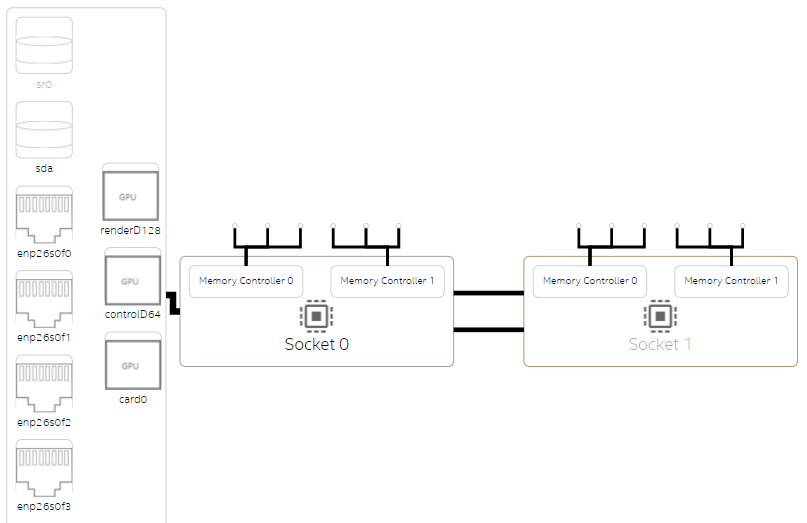
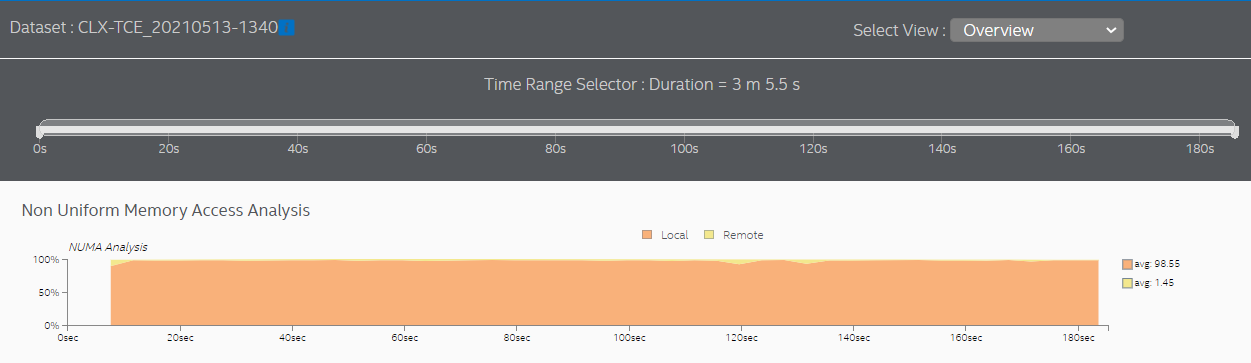
Start your analysis of NUMA issues by selecting Overview in the Select View pulldown menu. In the system configuration overview, you can see that a NUMA system typically has multiple processor sockets, each of which has memory controllers. This diagram is an example of a platform diagram for a two-socket system.
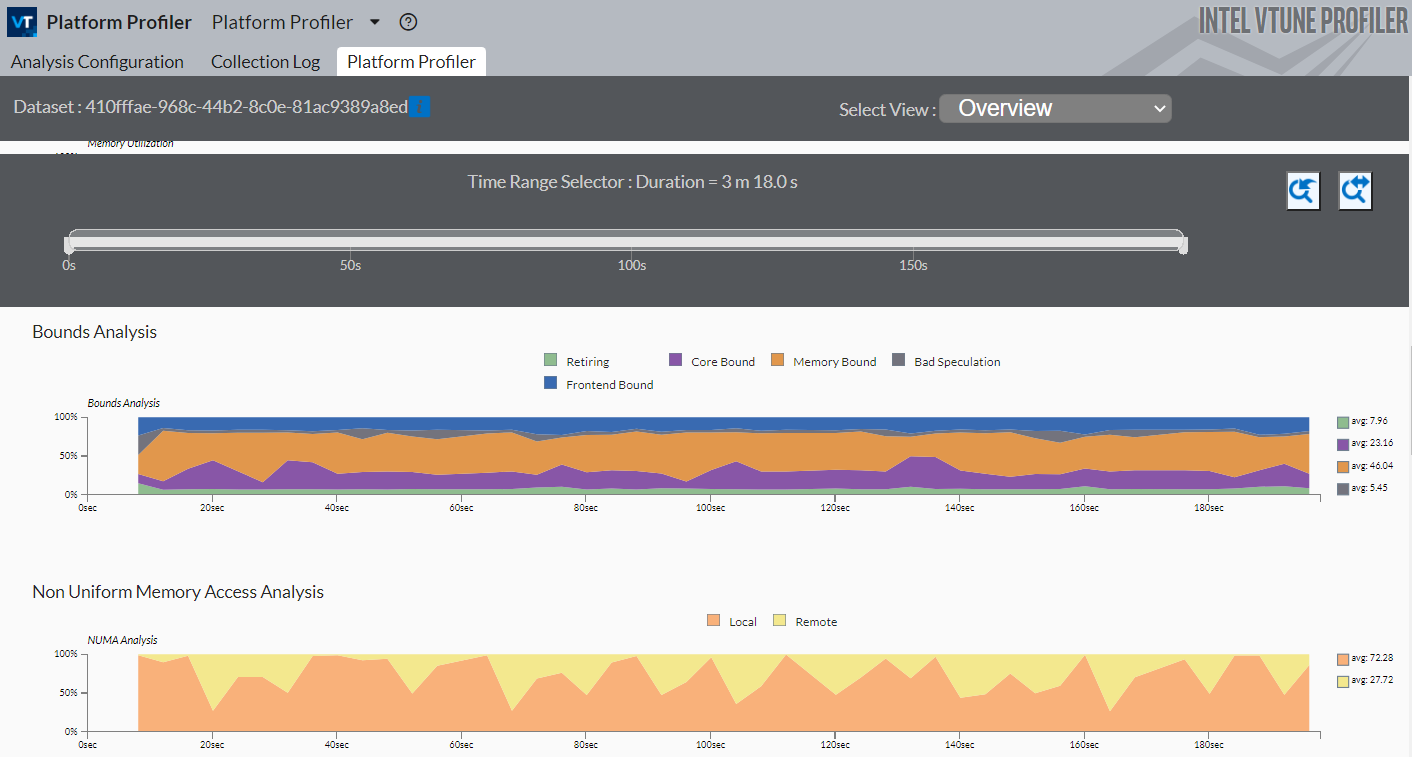
In the case of the sample application used here. the performance is mostly bound by memory access. There are a high number of memory accesses that are targeted to remote memory.
See the Non-Uniform Memory Access Analysis graph to compare local vs. remote memory accesses over time. A high percentage of remote accesses indicates a NUMA related performance issue.
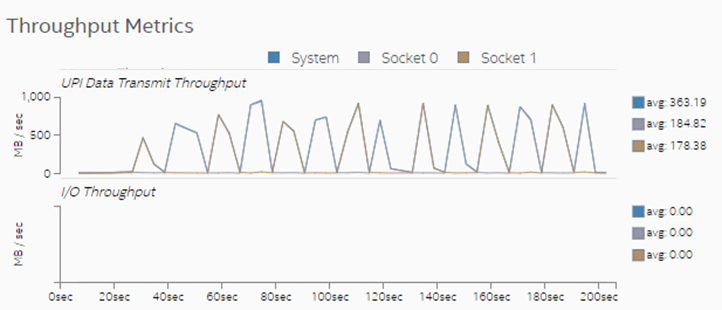
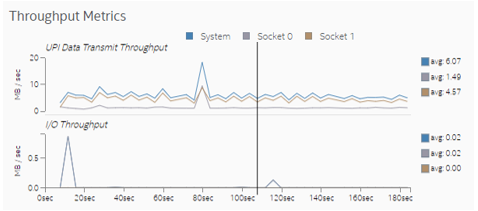
Observe the Throughput Metrics section. In this sample application, there are frequent spikes in cross-socket (UPI) traffic. These spikes correspond to remote memory accesses.
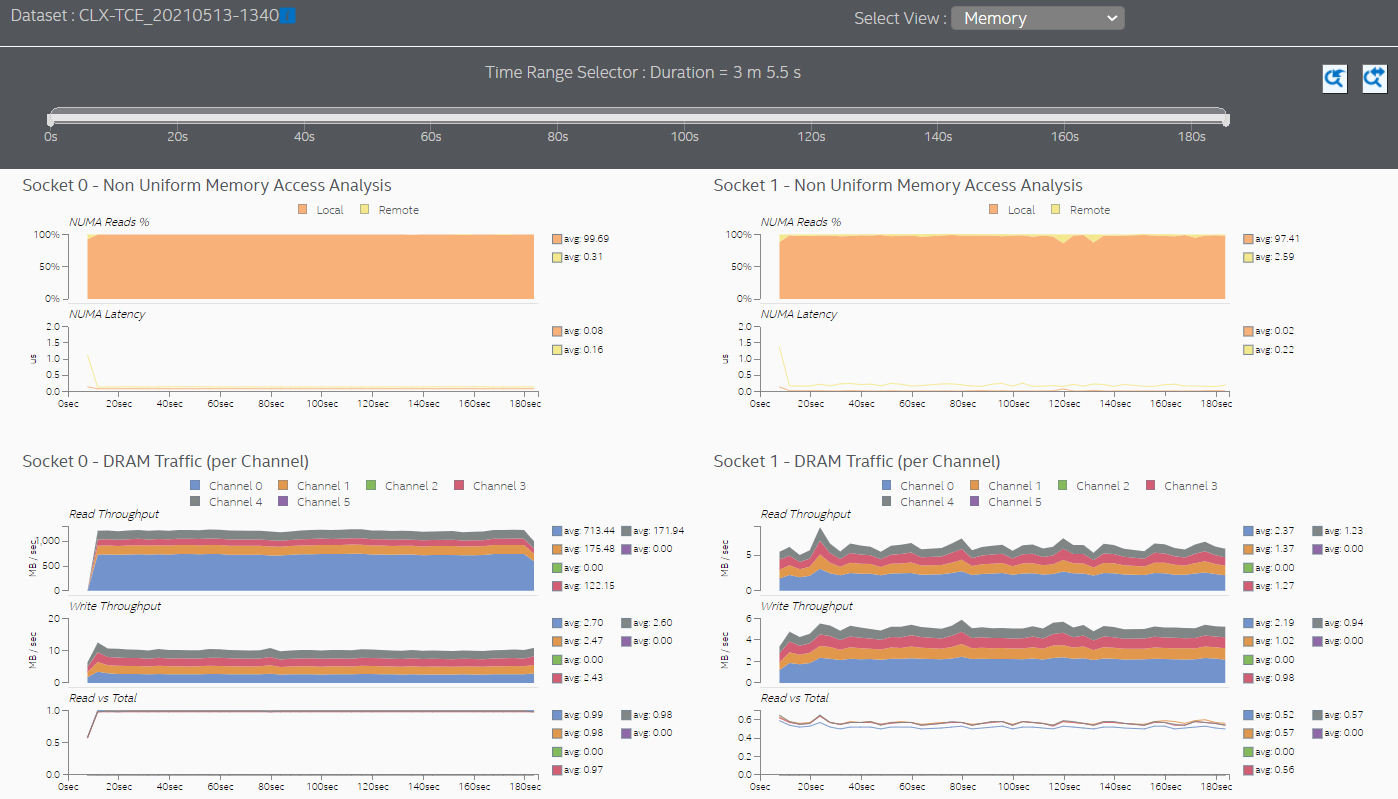
Switch to the Memory view to see additional information about memory accesses for each processor socket. In this sample application, both sockets initiate remote memory accesses.
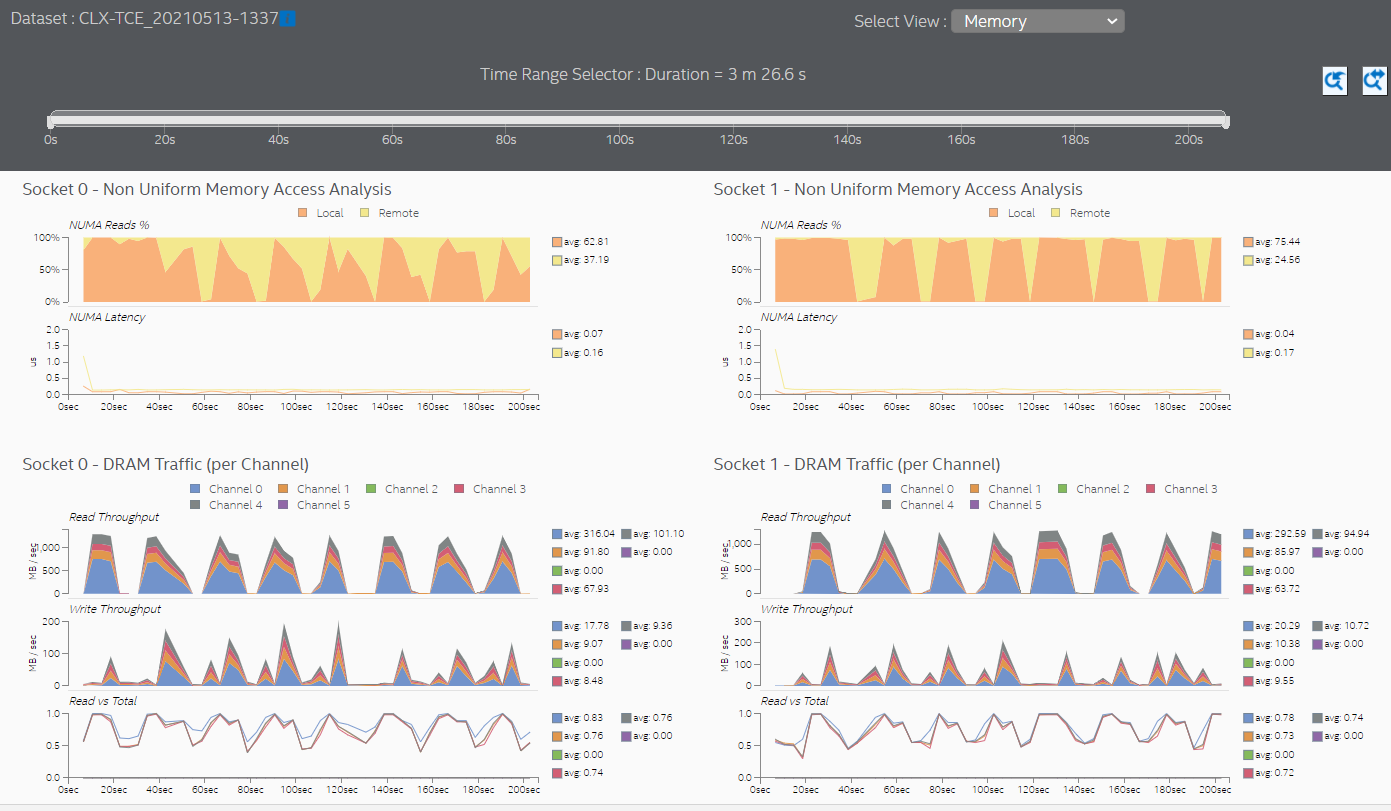
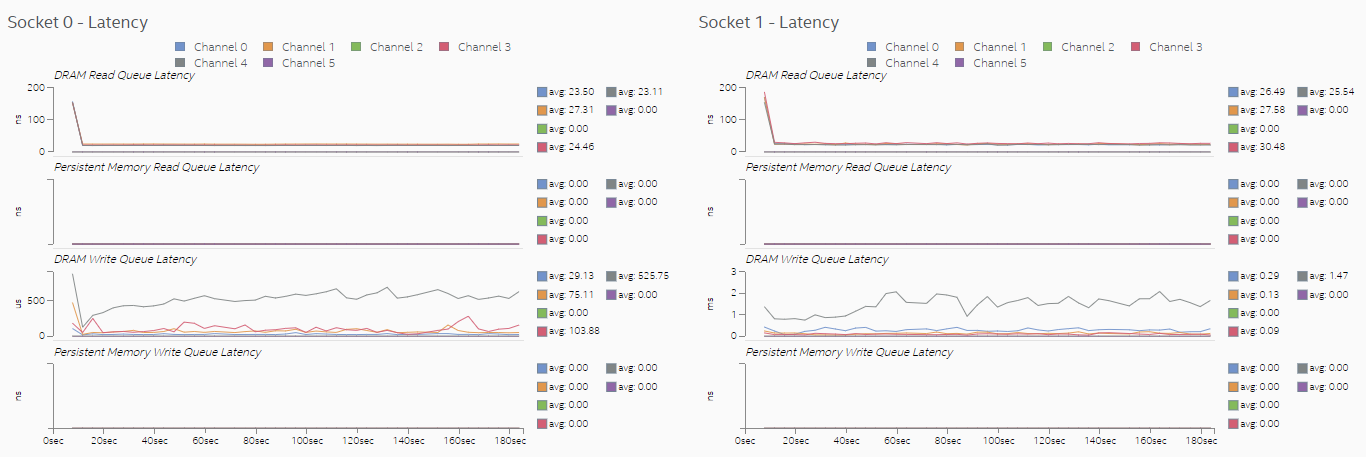
Latencies in memory accesses spike when the remote memory is accessed. These spikes indicate an opportunity for performance improvement.
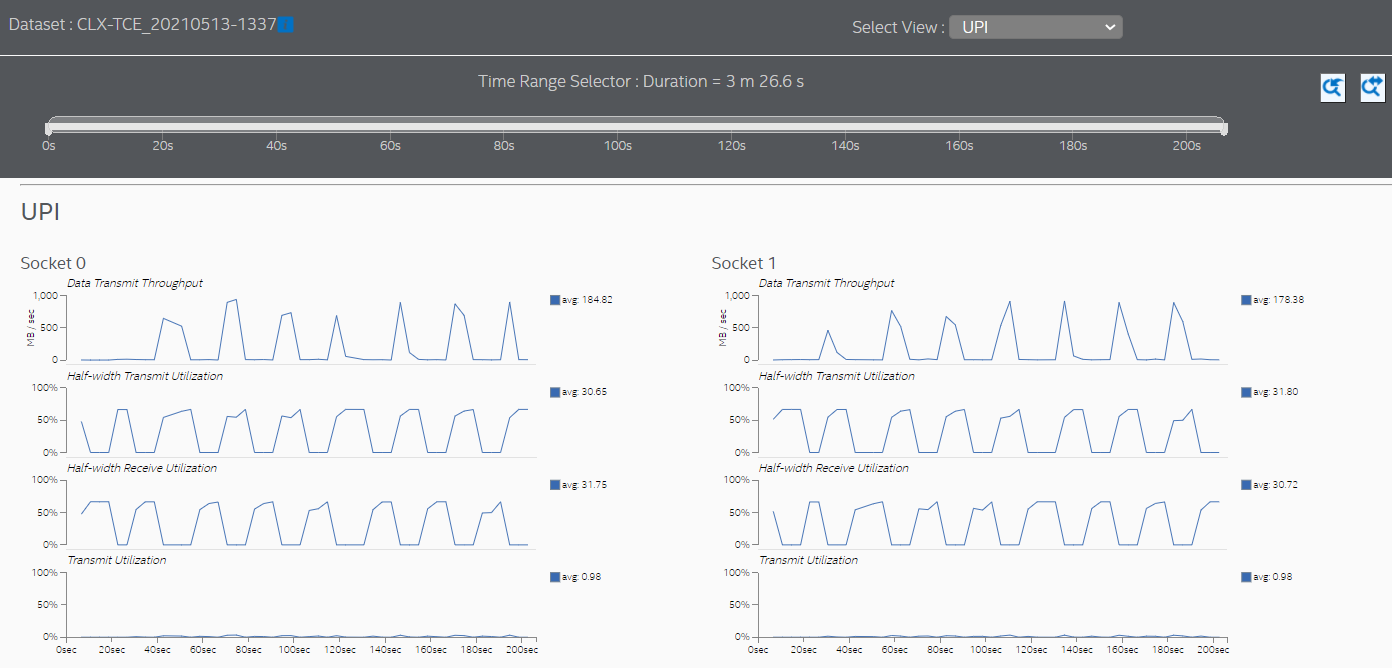
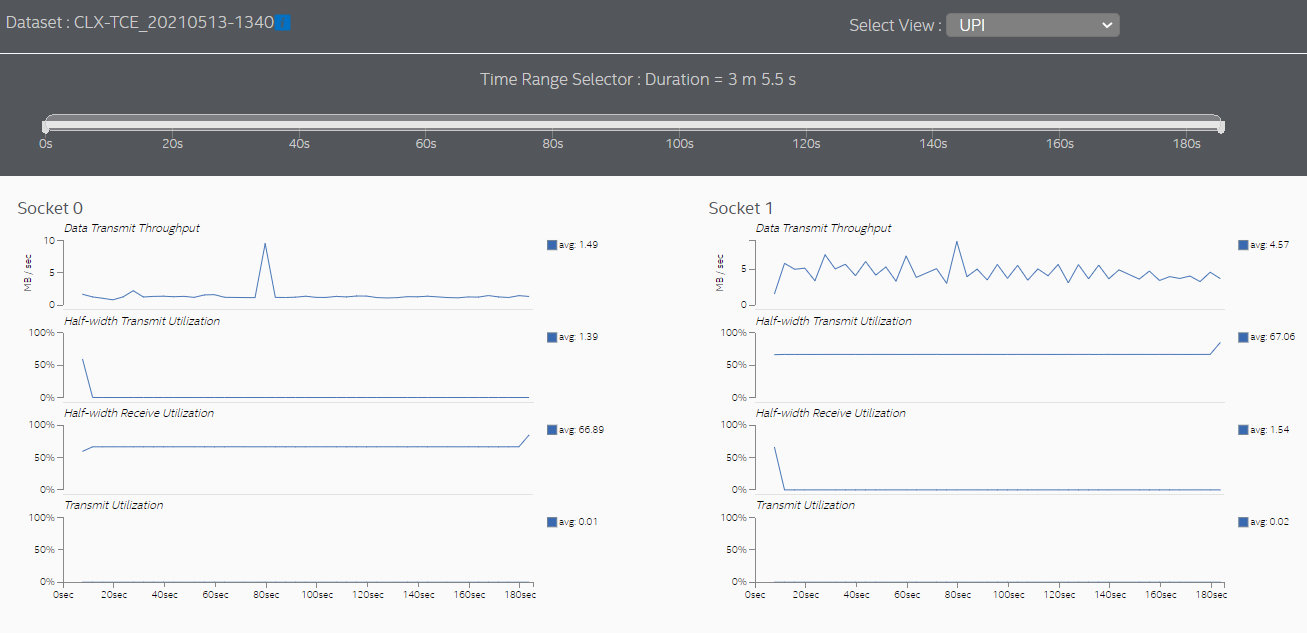
Switch to the UPI view to see the cross-socket traffic transmitted by each socket.
Set Thread CPU Affinity to Fix NUMA Issues
The sample application used in this recipe does not assign (or pin) software threads to specific sockets and cores. The absence of this assignment causes the operating system to periodically schedule threads on processor cores located in different sockets. In other words, the application is not 'NUMA-aware'. This condition results in frequent accesses to remote memory, which in turn result in high cross-socket traffic and higher memory access latencies.
One way to reduce remote memory accesses and cross-socket traffic is to assign the affinity of the processes which execute on the same memory ranges, to processor cores in the same socket. This assignment helps to maintain memory access locality. The programming guide for your operating system may recommend other approaches to reduce cross-socket traffic on NUMA systems.
Verify NUMA Optimizations
Once you have completed NUMA optimizations, run the Platform Profiler analysis again. The next graph shows memory accesses after assigning affinity to cores in socket 0.
In the sample used here, the results show that almost all memory accesses are now local accesses. Most cross-socket traffic spikes were eliminated.
The Memory view shows that both sockets are mostly accessing local memory.
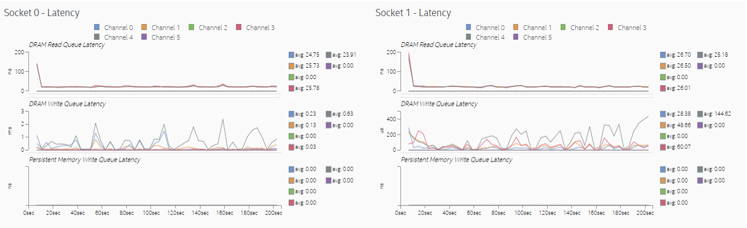
Setting thread CPU affinity and completing optimizations helped reduce memory access latencies significantly because more memory requests were directed to local memory. Observe in the Memory view that the scale of the DRAM Write Queue Latency graph changed from micro-seconds to nanoseconds.
The UPI view also shows much lower cross-socket traffic.
NOTE:
You can discuss this recipe in the Analyzers community forum.
Parent topic: Configuration Recipes