Visible to Intel only — GUID: GUID-1838021A-26D4-4838-9BA6-9E3E5F12F272
Introduction to Intel® Graphics Performance Analyzers
Game Optimization Methodology
Install and Launch Intel® GPA
Enable System-wide Time-based GPU Metrics and Enable Query-based Metrics for OpenGL* in Graphics Frame Analyzer for Ubuntu*
Launch Application for Analysis
Configure Analysis Settings
Quick Start with Profiling Unreal Engine* Games
Analyze Desktop Graphics Applications
Instrumentation and Tracing Technology API Support
Intel® GPA Reference
Notices and Disclaimers
Configure a Metric Set
Customize Keyboard Shortcuts
Set Up a Trigger
Set Up Tracing Options
Set Up Stream Options
Enable/Disable Deferred Stream Capture (DirectX 12, Vulcan)
Create Keyframe at Time Interval or at Key Press
Create Screenshot Every N Frames or Milliseconds
Enable/Disable HUD Layer
Enable/Disable Metrics Collection
Set Frame Delimiters
Visible to Intel only — GUID: GUID-1838021A-26D4-4838-9BA6-9E3E5F12F272
Set Up Stream Options
With Intel® GPA, you can capture streams - sets of consecutive frames - and analyze them with Frame Analyzer. To modify the stream options:
- In the Graphics Monitor Launcher screen, click the Options button.
- Go to the Stream tab and configure the available stream options:
Enable/Disable Deferred Stream Capture (DirectX 12, Vulcan)
By default, stream capture starts when you start the application. The Deferred stream capture option allows you to choose a particular scene in your application and capture a stream manually from the beginning till the end of that scene.
When enabled, press L (default) to start or stop stream capture.
Create Keyframe at Time Interval or at Key Press
A keyframe is a saved state of an application, from which you can play back the captured stream. When you select a frame from the stream for analysis, Graphics Frame Analyzer plays this stream from the beginning till the selected frame to open it. When you set keyframes, Graphics Frame Analyzer starts playing the stream from the keyframe closest to the selected frame, which saves time.
When enabled, press K (default) to create a keyframe.
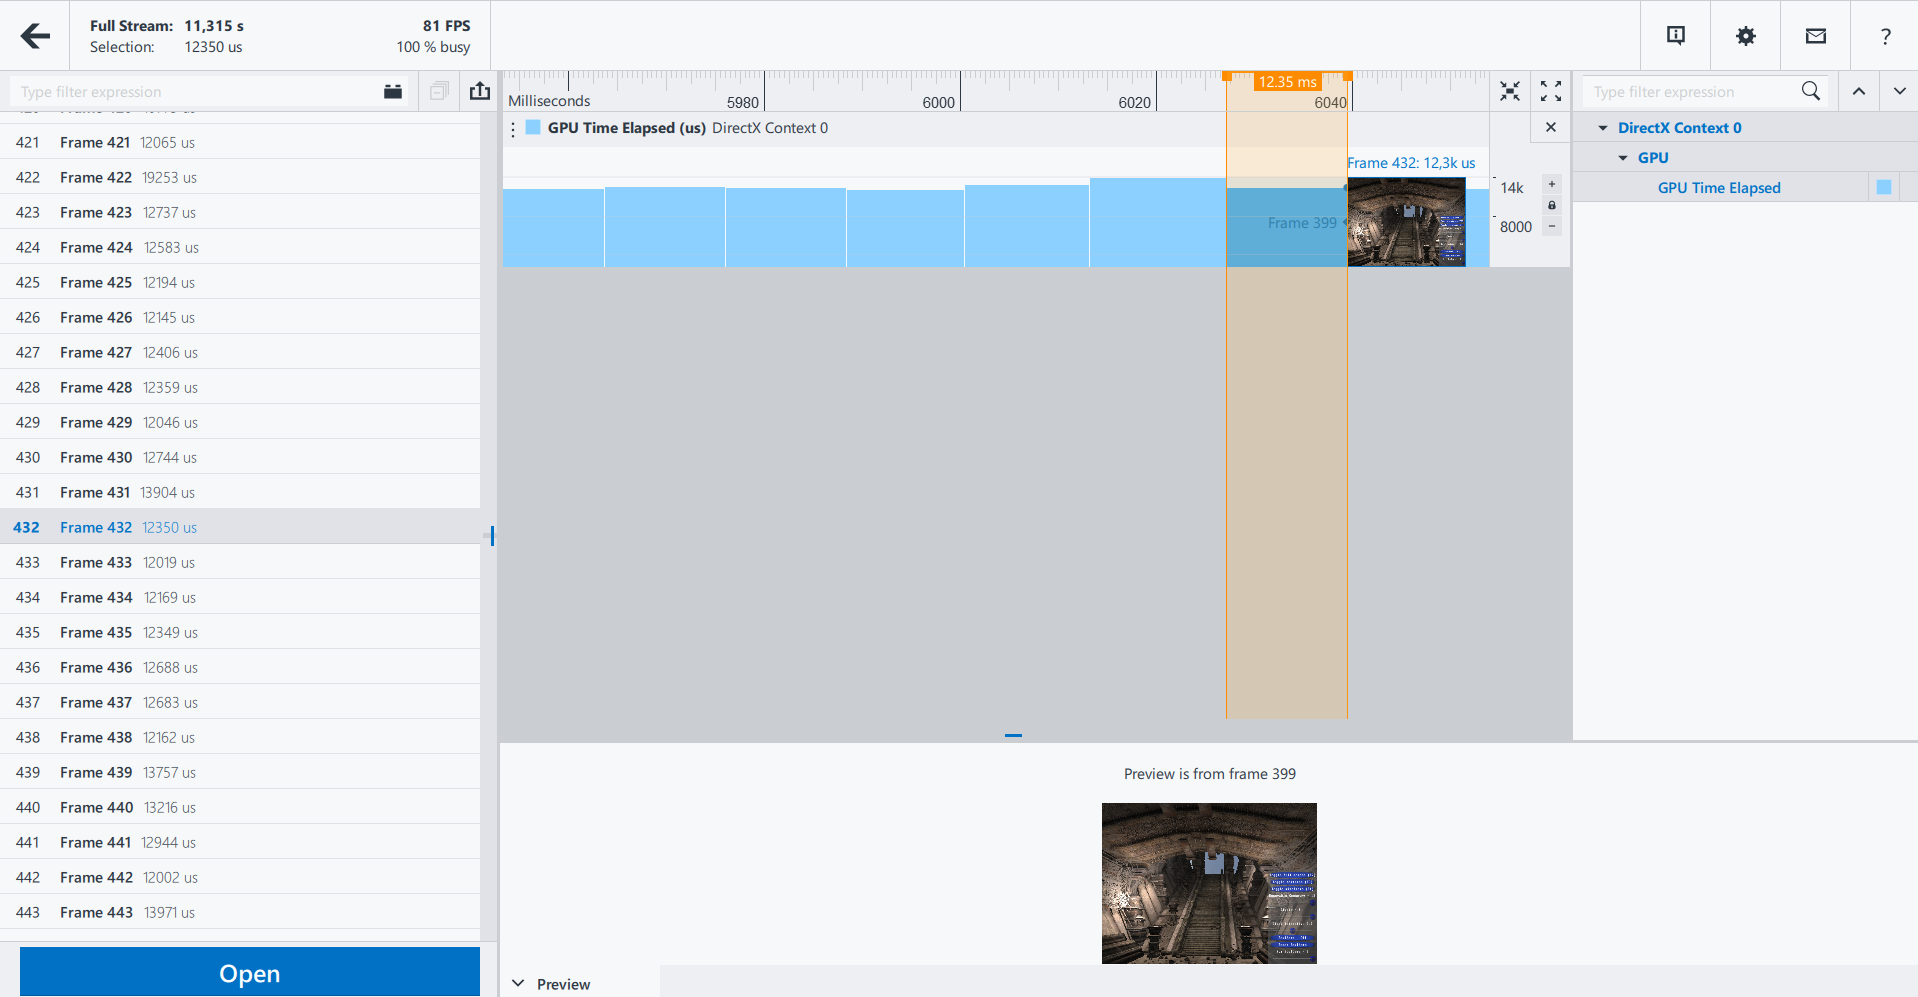
Create Screenshot Every N Frames or Milliseconds
The Preview pane of Frame Analyzer displays screenshots captured for the opened stream. This helps you find the frames you are interested in by seeing the picture.
NOTE:
- Screenshot creation can cause additional overhead. Disable this option if you suspect that there is excessive overhead.
- "No preview is available for current selection" message may appear for the first frames, if you enable screenshots creation.
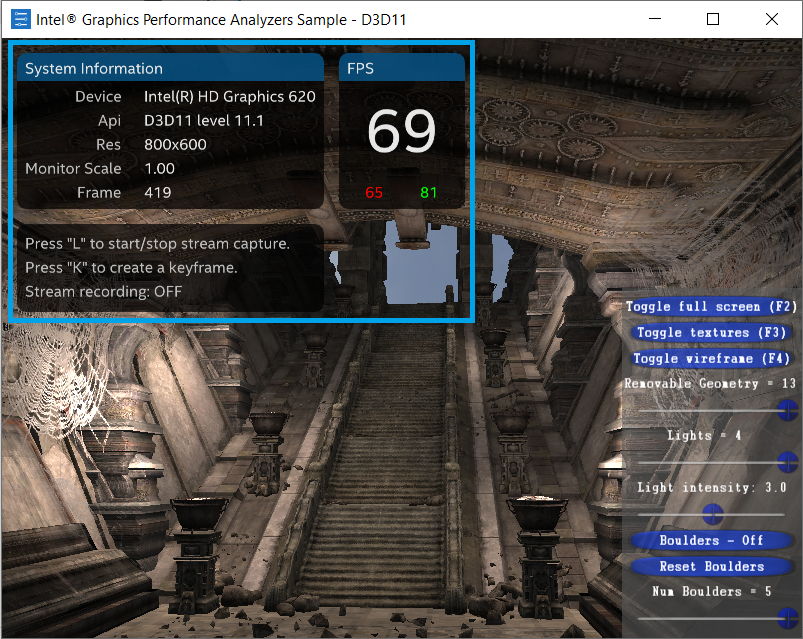
Enable/Disable HUD Layer
HUD works in the background while your game is running and displays an overlay on your game, allowing you to quickly see the performance overview of your game.
With the HUD layer, you can find a problematic scene with low FPS and capture a stream of this scene for further in-depth analysis.
Enable/Disable Metrics Collection
When you enable GPU and CPU metrics collection, Frame Analyzer displays them in the Multi-frame View window, allowing you to find problematic frames.
Parent topic: Configure Analysis Settings
See Also
Analyze GPU-bound Applications with Graphics Frame Analyzer Use Graphics Frame Analyzer to locate GPU bottlenecks, root-cause rendering issues, and increase performance.