Identify High-impact Opportunities to Offload to GPU
With the Offload Modeling perspective of the Intel® Advisor, you can model performance of your application on a target graphics processing unit (GPU) device and identify code regions that are the most profitable to run on the target GPU.
Offload Modeling perspective has two workflows:
- With CPU-to-GPU modeling, you can profile an application running on a CPU and model its performance on a target GPU device to determine if you should offload parts of your application to the GPU.
- With GPU-to-GPU modeling, you can profile an application running on a GPU and model its performance on a different GPU device to estimate a potential speedup from running your application on the different target.
This page explains how to profile a vector-add sample with CPU-to-GPU modeling and estimate its speedup on a target GPU.
Follow the steps:
Prerequisites
- Download the vector-add code sample from oneAPI samples GitHub* repository.
You can also use your own application to follow the instructions below.
- Install the Intel Advisor as a standalone or as part of Intel® oneAPI Base Toolkit. For installation instructions, see Install Intel Advisor in the user guide.
- Install the Intel® oneAPI DPC++/C++ Compiler as a standalone or as part of Intel® oneAPI Base Toolkit. For installation instructions, see Intel® oneAPI Toolkits Installation Guide.
- Set up environment variables for the Intel Advisor and Intel oneAPI DPC++/C++ Compiler. For example, run the setvars script in the installation directory.
This document assumes you installed the tools to a default location. If you installed the tools to a different location, make sure to replace the default path in the commands below.
IMPORTANT:Do not close the terminal or command prompt after setting the environment variables. Otherwise, the environment resets.
Build Your Application
On Linux* OS
From the terminal where you set the environment variables:
- Navigate to the vector-add sample directory.
- Compile the application using the following command:
icpx -g -fiopenmp -fopenmp-targets=spir64 -fsycl src/vector-add-buffers - Run the application with a vector size 100000000 to verify the build as follows:
./vector-add-buffers 100000000If the application is built successfully, you should see the output similar to the following:
Vector size: 100000000
[0]: 0 + 0 = 0
[1]: 1 + 1 = 2
[2]: 2 + 2 = 4
...
[99999999]: 99999999 + 99999999 = 199999998
Vector add successfully completed on device.
The vector-add-buffers application uses SYCL and runs on a GPU by default. For the workflow in the topic, you should temporarily offload it to a CPU to analyze as described in the section below.
On Windows* OS
From the command prompt where you set the environment variables:
- Navigate to the vector-add sample directory.
- Compile the application using the following command:
icx-cl -fsycl /O2 /EHsc /Zi -o vector-add-buffers.exe src/vector-add-buffers.cpp - Run the application with a vector size 100000000 to verify the build as follows:
vector-add-buffers.exe 100000000If the application is built successfully, you should see the output similar to the following:
Vector size: 100000000
[0]: 0 + 0 = 0
[1]: 1 + 1 = 2
[2]: 2 + 2 = 4
...
[99999999]: 99999999 + 99999999 = 199999998
Vector add successfully completed on device.
The vector-add-buffers application uses SYCL and runs on a GPU by default. For the workflow in the topic, you should temporarily offload it to a CPU to analyze as described in the section below.
Model Application Performance Running on a GPU
Run Offload Modeling from Graphical User Interface (GUI)
- From the terminal or command prompt where you set the environment variables, launch the Intel Advisor GUI:
advisor-gui - Create a vector-add project for the vector-add-buffers application. Follow the instructions in the Before You Begin page. When you have the Project Properties dialog box open:
- Go to the Analysis Target tab > Survey Analysis Types > Survey Hotspots Analysis.
- Click Browse… near the Application field and navigate to the vector-add-buffers application. Click Open.
- To set the vector size, in the Application parameters field, type 100000000.
- To offload the application to a CPU temporarily, click Modify… near the User-defined environment variables field. The User-defined Environment Variables dialog box opens.
- Click the empty line in the Variable column and enter variable name SYCL_DEVICE_FILTER.
- Click the empty line in the Value column and enter variable value opencl:cpu.
- Click OK to save the changes.
- Go to the Analysis Target tab > Survey Analysis Types > Trip Counts and FLOP Analysis and make sure the Inherit Settings from Survey Hotspots Analysis Type checkbox is selected.
- Click OK to create the project.
- In the Perspective Selector window, choose the Offload Modeling perspective.
- In the Analysis Workflow pane, select the following parameters:
- Make sure the baseline device is set to CPU.
- Set accuracy to Medium.
- Select the Gen11 GT2 target device.
- Click
 button to run the perspective.
 During the perspective execution with medium accuracy, Intel Advisor:
- Analyzes your application total execution time and execution time of its loops/functions using the Survey analysis
- Counts how many iterations each cycle performs during application runtime using Characterization analysis
- Estimates execution time for code regions that can be offloaded to a target GPU and total time to transfer data from a CPU to a target GPU using the Performance Modeling analysis
When the execution completes, the Offload Modeling result is opened automatically.
Run Offload Modeling from Command Line Interface (CLI)
On Linux OS
From the command prompt where you set the environment variables:
- Navigate to the vector-add sample directory.
- Temporarily offload the application to a CPU with the SYCL_DEVICE_FILTER environment variable as follows:
export SYCL_DEVICE_FILTER=opencl:cpu - Run the Offload Modeling perspective with the medium accuracy level using the command-line collection preset:
advisor --collect=offload --config=gen11_icl --project-dir=./vector-add -- vector-add-buffers 100000000This command runs the Offload Modeling perspective analyses for the default medium accuracy level one by one. During the perspective execution, Intel Advisor:
- Analyzes your application total execution time and execution time of its loops/functions using the Survey analysis
- Counts how many iterations each cycle performs during application runtime using Characterization analysis
- Estimates execution time for code regions that can be offloaded to a target GPU and total time to transfer data from a CPU to a target GPU using the Performance Modeling analysis
When the execution completes, the vector-add project is created automatically, which includes the Offload Modeling results. You can view them with a preferred method.
On Windows OS
From the command prompt where you set the environment variables:
- Navigate to the vector-add sample directory.
- Temporarily offload the application to a CPU with the SYCL_DEVICE_FILTER environment variable as follows:
set SYCL_DEVICE_FILTER=opencl:cpu - Run the Offload Modeling perspective with the medium accuracy level using the command-line collection preset:
advisor --collect=offload --config=gen11_icl --project-dir=.\vector-add -- vector-add-buffers.exe 100000000This command runs the Offload Modeling perspective analyses for the default medium accuracy level one by one. During the perspective execution, Intel Advisor:
- Analyzes your application total execution time and execution time of its loops/functions using the Survey analysis
- Counts how many iterations each cycle performs during application runtime using Characterization analysis
- Estimates execution time for code regions that can be offloaded to a target GPU and total time to transfer data from a CPU to a target GPU using the Performance Modeling analysis
When the execution completes, the vector-add project is created automatically, which includes the Offload Modeling results. You can view them with a preferred method.
Examine Application Performance Estimated on the GPU
If you collect data using GUI, Intel Advisor automatically opens the results when the collection completes.
If you collect data using CLI, open the results in GUI using the following command:
advisor-gui ./vector-addIf the result does not open automatically, click Show Result.
You can also view the results in an interactive HTML report. The report data and structure are similar to the GUI results. You can share this report or open it on a remote system even if it does not have Intel Advisor installed. See Work with Standalone HTML Reports in the Intel Advisor User Guide for details.
NOTE:
The results that you see when you open the report might be different from what is shown in the following sections due to a different baseline device or system characteristics. You can still review the sections to understand the result analysis workflow in general.
Explore Performance Estimations for the Whole Application
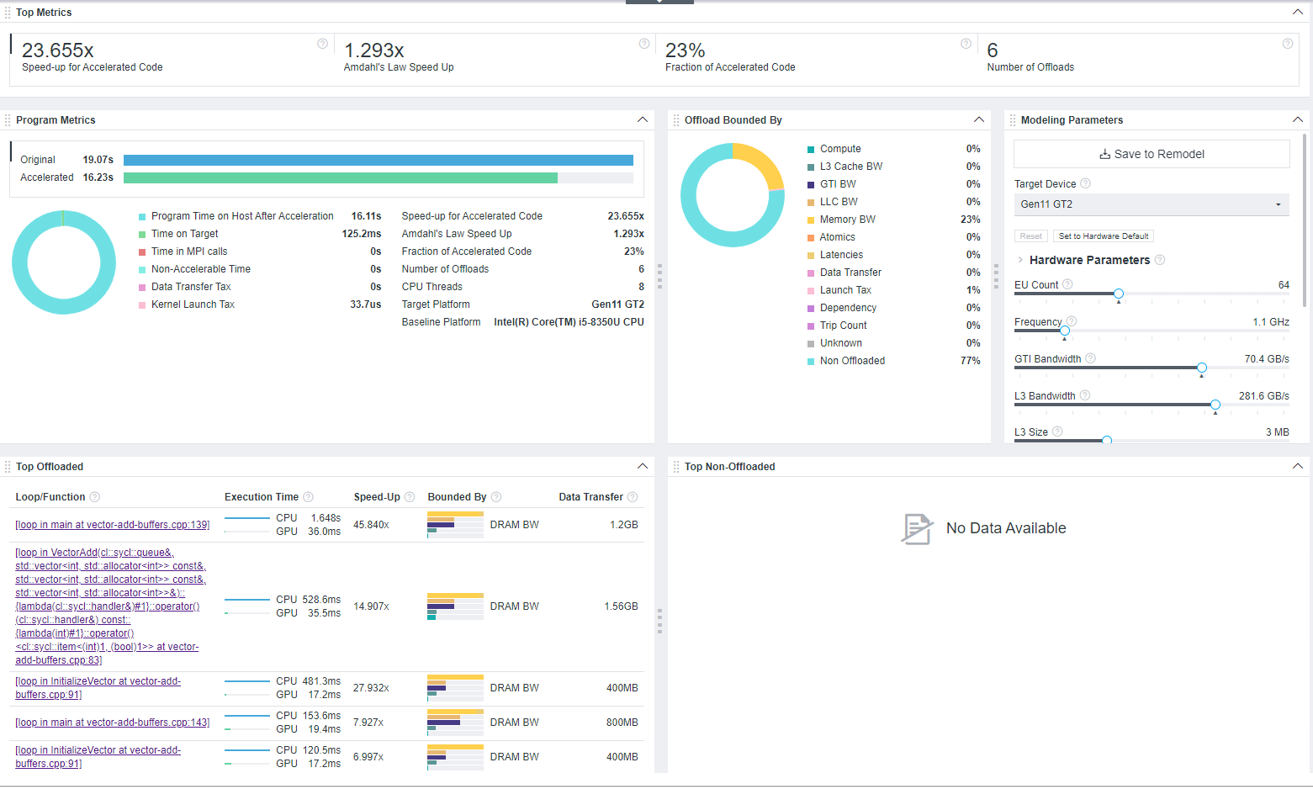
When you open the Offload Modeling result in GUI, Intel Advisor shows the Summary tab first. This window is a dashboard containing the main information about application execution measured on a baseline device and estimated on a target GPU, estimated speedup, and more.
In the Summary window, notice the following:
- As the Top Metrics pane shows, speedup estimated for offloaded parts of the vector-add-buffers code only is 23.655x, but the speedup calculated by the Amdahl's law, which is the speedup for the whole application, is only 1.293x. This means that although the offloaded code regions can run faster on the GPU, they do not have a big impact on the overall application speedup. It might be because only 23% of the code is recommended for offloading.
- Explore per-application metrics in the Program Metrics pane. The estimated time on the target GPU (accelerated time) is 16.23 seconds, which includes 16.11 seconds on a host device and 125.2 milliseconds on the target device.
- Investigate the factors that limit your offloaded code regions in the Offload Bounded By pane. This pane characterizes all potential bottlenecks for the whole application, such as compute, data transfer, and latencies, with percentage of code impacted.
The vector-add-buffers application has 77% of non-offloaded code. The offloaded code is mostly bounded by host memory bandwidth (23%), which means that the application might be memory-bound after offloading as it underutilizes memory resources on the host device. If you optimize how the application uses memory after offloading or increase memory bandwidth, you might improve application performance.
You can see the bottlenecks per code region in the Top Offloaded pane by hovering over a histogram in the Bounded By column.
- In the Hardware Parameters pane, notice the host memory bandwidth for the current modeled Gen11 GT2 device is 48 GB/s.
You can move the Memory BW slider in the pane to increase the value and remodel application performance for a custom device with higher memory bandwidth from command line. You may get a better estimated performance.
You can use this pane to adjust GPU parameters to model performance on a different device with custom parameters.
- Examine the loops/functions with the highest speedup achieved by offloading to a GPU in the Top Offloaded pane. The topmost loop [loop in main at vector-add-buffers.cpp:139] has the highest estimated speedup on the target. You can click a loop to switch to the Accelerated Regions tab and explore the loop performance on the target GPU in more detail.
Analyze Estimated Performance for Specific Loops
In the Accelerated Regions tab, you can analyze estimated performance for each loop and check what loops are recommended to be offloaded to the target GPU.
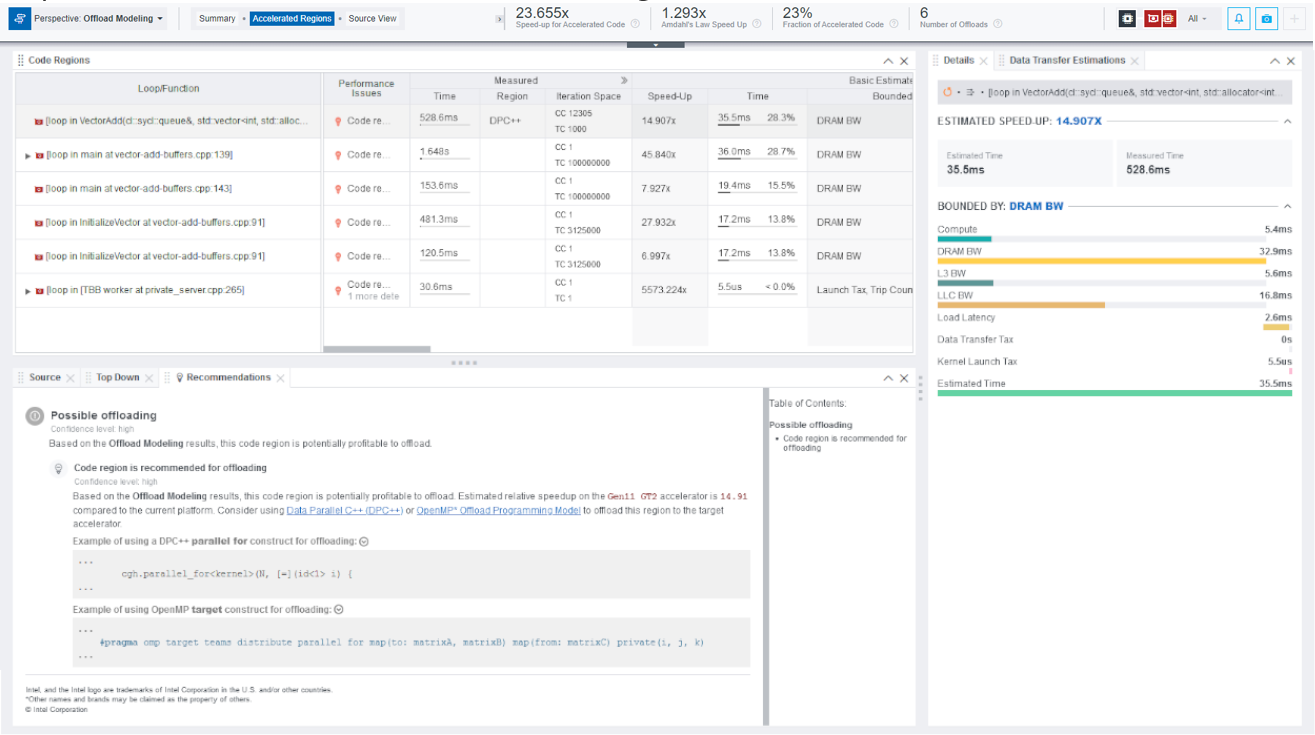
Intel Advisor reports 5 loops/functions as potentially profitable to be offloaded to the target GPU.
- In the bottom pane, switch to the Source tab to examine code region sources.
- Click each loop in the Code Regions pane and examine its source in the Source tab to understand code region purpose.
- [loop in main at vector-add-buffers.cpp:139] is a loop that is supposed to run on a host device to be compared with the execution result of the main loop.
- [loop in VectorAdd(…)<…> at vector-add-buffers.cpp:83] is the main loop that adds vectors. It is a SYCL kernel.
- [loop in main at vector-add-buffers.cpp:143] is a loop that is supposed to run on a host device to compare the results of the [loop in VectorAdd(…)<…> at vector-add-buffers.cpp:83] and [loop in main at vector-add-buffers.cpp:139].
- [loop in InitializeVector at vector-add-buffers.cpp:91] is a loop that initializes data.
- [loop in [TBB worker at private_server.cpp:265] is a subordinate oneAPI Threading Building Blocks loop.
Based on application source analysis, [loop in VectorAdd(…)<…> at vector-add-buffers.cpp:83] is the only offload candidate.
- Click the [loop in VectorAdd(…)<…> at vector-add-buffers.cpp:83] loop in the Code Regions pane to analyze its performance in more details and examine the following metrics:
- The original time measured on a baseline CPU device is 528.6 milliseconds (Measured column group), time estimated on the target GPU after offload is 36 milliseconds (Basic Estimates Metrics column group), which is 14.907% of the total estimated time on the target GPU. This means that the code region can run 45.840x times faster on the target as reported in the Speed-Up column in Basic Estimates Metrics.
- In the Summary window, you saw that the application is mostly memory-bound on the target GPU. As indicated in the Bounded By column (Basic Estimated Metrics), the selected code region is bounded by DRAM bandwidth.
- Scroll to the right to the Estimated Bounded By column group. As indicated in the Throughout column, the code region spends 32.9 milliseconds to read from and write to the DRAM memory.
- Scroll to the Estimated Data Transfer with Reuse to see the estimated data traffic modeled between host and target devices.
- Scroll to the right to the Memory Estimations column group to see the traffic between target device memory levels modeled with cache simulation analysis. The column group shows traffic for each memory level on the target, such as L3 cache, last-level cache (LLC), DRAM memory, GTI memory.
- Examine performance summary for the selected code region in the Details pane on the right. As the pane reports, total estimated time for the code region is 36 milliseconds, which includes:
- 5.4 milliseconds for computing vector addition
- 32.9 milliseconds for reading from and writing to DRAM
- 5.6 milliseconds for reading from and writing to L3 cache
- 16.8 milliseconds for writing to last level cache (LLC)
This means the code region mostly spends time for working with memory.
- View actionable recommendations for the selected loop in the Recommendations tab. Intel Advisor recommends you offload the selected loop to the target as it has high estimated speedup. The recommendation includes example code snippets for offloading the loop using SYCL or OpenMP*, which you can expand to see more syntax.
You can also view the selected loop in using the Top-Down tab to locate it in the application call tree and see how it is related to other loops and examine its source code using the Source tab
Continue to examine the performance of other code regions in the application to get a better understanding on its performance estimated on the target.
Next Steps
- In the Code Regions pane, notice that [loop in VectorAdd(…)<…> at vector-add-buffers.cpp:83] has Parallel: Explicitdependency type, but there are three other loops/functions that have Parallel: Assumed dependency type reported (Measured column group). This means Intel Advisor does not have information about dependencies in these code regions, but it assumes there are no dependencies and the loops/functions can be parallelized.
In most cases, if a loop has dependencies, it is not recommended to offload it to the target GPU. You can analyze the loop-carried dependencies with the Dependencies analysis of the Intel Advisor. See Check How Assumed Dependencies Affect Modeling in the user guide for a recommended workflow.
- If Intel Advisor detects real loop-carried dependencies, it models them as sequential kernels. Usually, such kernels are not profitable to run on a GPU. You need to resolve the dependencies before you offload your code to the target.
- Get more detailed report about data transfers in the application by running the Characterization analysis with a different data transfer simulation mode: medium to understand how memory objects are transferred or full to check if data reuse can improve the application performance.
Based on the data reported about the vector-add-buffers sample application, you can run it on the target GPU and optimize its performance or you can run other analyses to learn more about application behavior on the target GPU. After this, you can use GPU Roofline Insights perspective to profile application actual performance on the target GPU and see how it uses hardware resources.
Parent topic: Get Started with Intel® Advisor