Defect Detection Demo
Prerequisite: The Defect Detection Demo tutorial requires video pipeline services, which are available in the Video Analytics or Video Analytics and Time series use cases installer package downloaded through the Download option for the Edge Insights for Industrial package.
In this tutorial, you’ll run the Defect Detection Demo to verify that Edge Insights for Industrial was installed successfully and to start getting familiar with its modules and structure. By following this tutorial, you will learn:
How to start Edge Insights for Industrial
How to visualize the results of the demo application
How the application works at a high level
NOTE:
Be aware that screenshots may show a package version number that is different from the current release. See the Release Notes for information on the current release.
How it Works
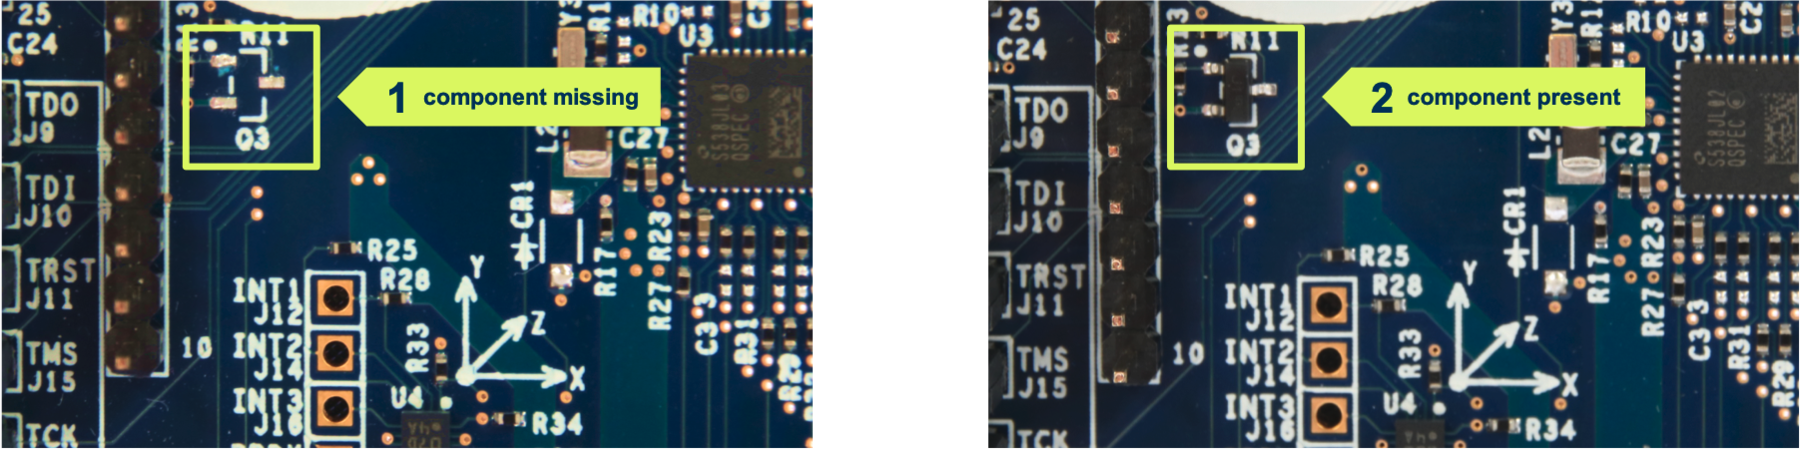
The Defect Detection Demo performs a quality control inspection on a video of the printed circuit boards (PCBs). In this scenario, the PCBs are inspected for quality control and detects two types of defects:
A missing component. In the following illustration, PCB #1, on the left, is missing a component. PCB #2, on the right, shows the component in place:
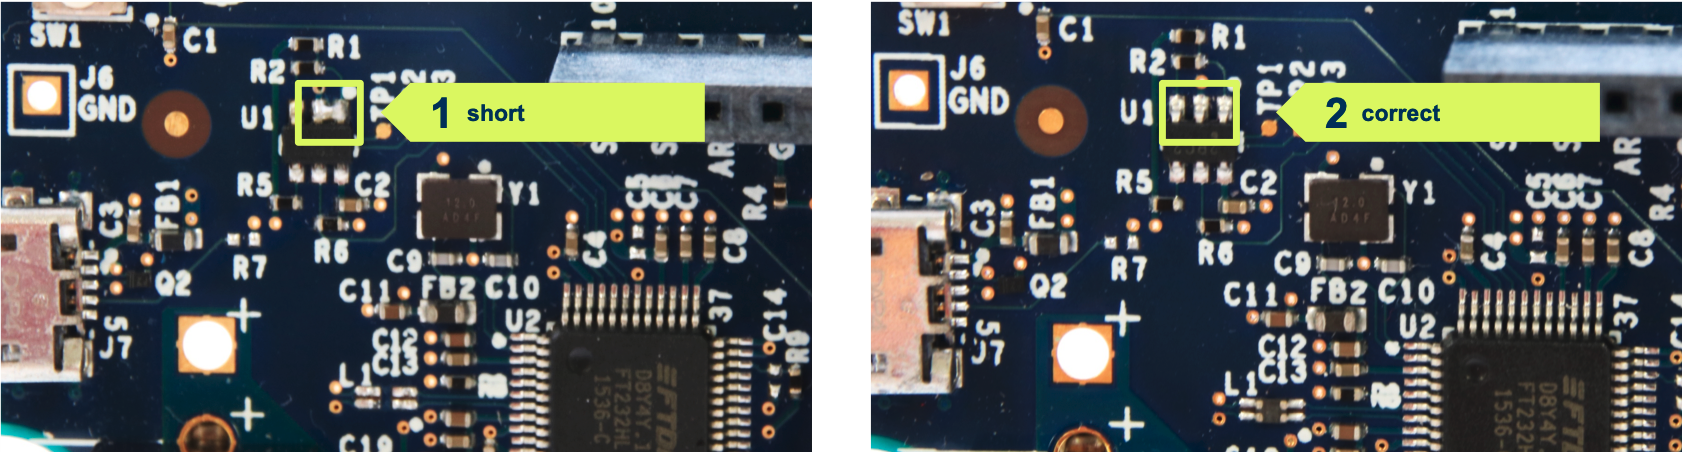
A component short: In the following illustration, PCB #1, on the left, has two solder joints connected that should not be connected, resulting in a short. PCB #2, on the right, shows the correct solder:
Step 1: Start the Edge Insights for Industrial Containers
Run the Edge Insights for Industrial:
xhost +
cd $HOME/edge_insights_industrial/Edge_Insights_for_Industrial_<version>/IEdgeInsights/build
sudo ./eii_start.sh
where <version> indicates the downloaded version of Edge Insights for Industrial.
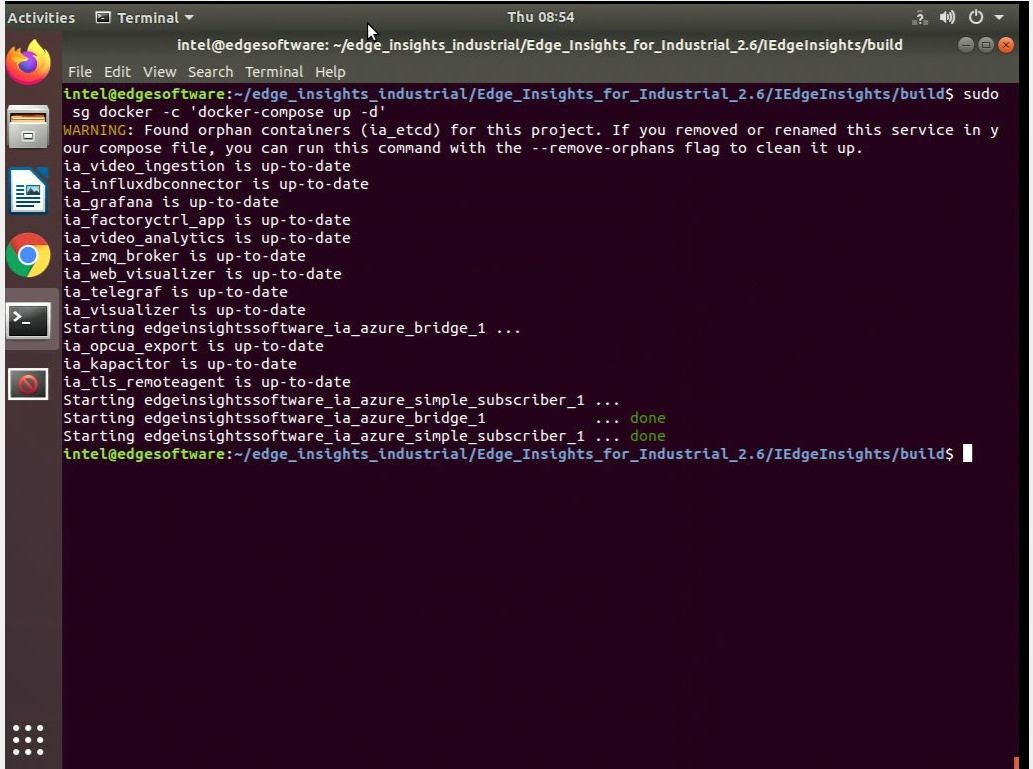
Success is indicated by a screen similar to:
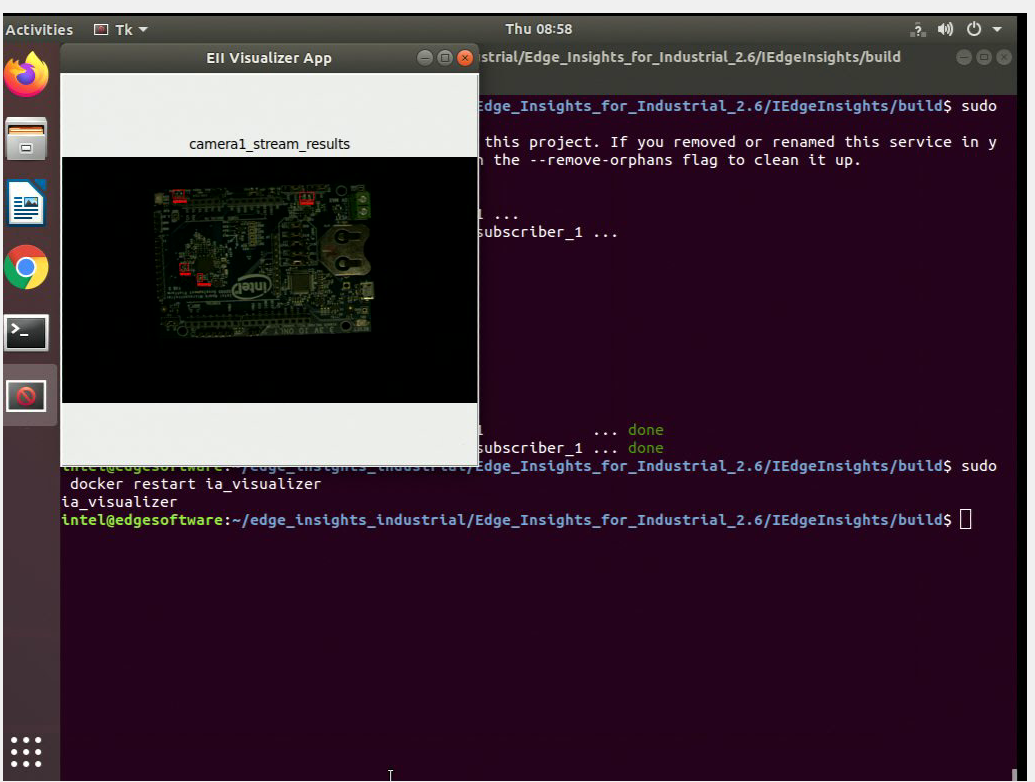
In addition, the visualizer displays an image that displays metadata and a separate window that shows the PCB image with the defects outlined by red boxes:
 NOTE:If the Visualizer UI does not show up and you notice the error couldn't connect to display ":0" after running the command docker logs -f ia_visualizer, check the value of the DISPLAY environment variable on the host machine. Use the command:
env | grep DISPLAY
Set the value for the DISPLAY environment variable in the ia_visualizer service in the HOME/edge_insights_industrial/Edge_Insights_for_Industrial_<version>/IEdgeInsights/build/docker-compose.yml file. Then bring up the ia_visualizer UI with the command:
docker-compose up ia_visualizer
For example,
$ env | grep DISPLAY
DISPLAY=:1
Set =:1 as the DISPLAY environment value in the ia_visualizer service in thedocker-compose.yml file.
Verify the containers are running:
docker ps
The result looks similar to:
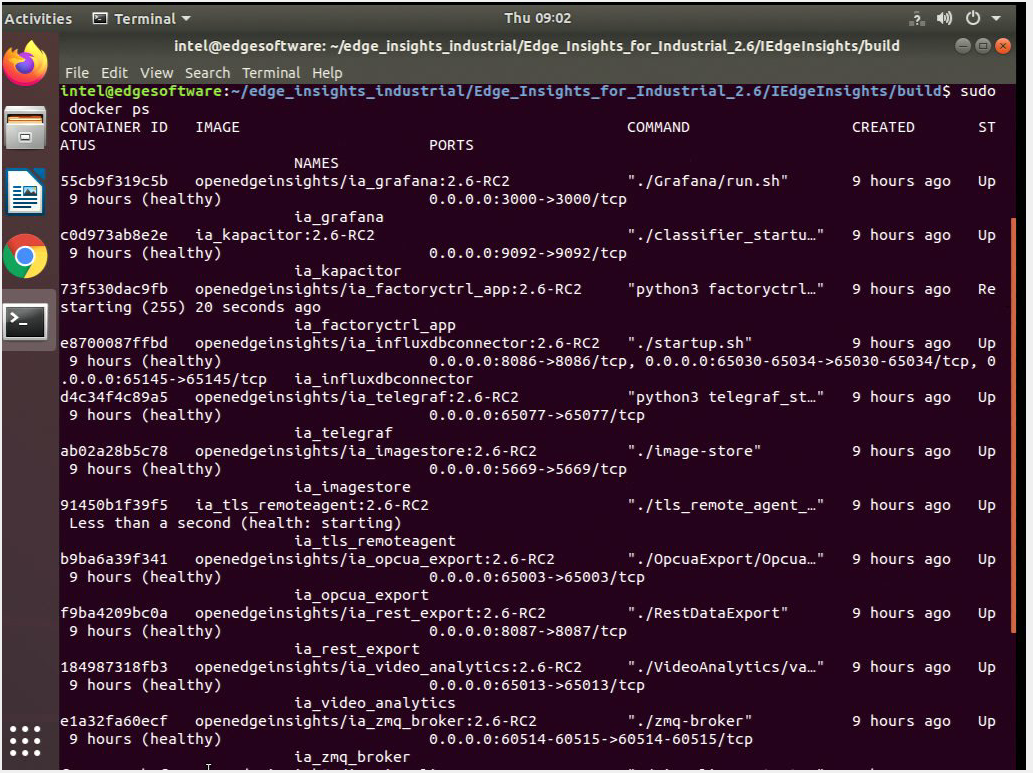
The following table describes the contents of the screen.
Note that <version> indicates the downloaded version of Edge Insights for Industrial.
Image Column Content
Description
ia_video_ingestion:<version>
Ingests video frames from a video source, like a video file or camera, using the GStreamer* pipeline. Data, consisting of a frame and metadata, is published to the message bus.
ia_video_analytics:<version>
Use OpenVINO™ on the data to perform inference. The data are received from the video ingestion and new data is published to the message bus.
ia_visualizer:<version>
Use a Python-based visualizer to display the frame sent by video analytics.
ia_etcd:<version>
etcd* provides endpoint configurations to establish the message bus and configuration of Edge Insights for Industrial containers.
ia_etcd_ui:<version>
Web user interface for etcd* configurations.
Check the log files to verify the data pipeline in Edge Insights for Industrial is working correctly:
sudo docker logs -f ia_video_analytics
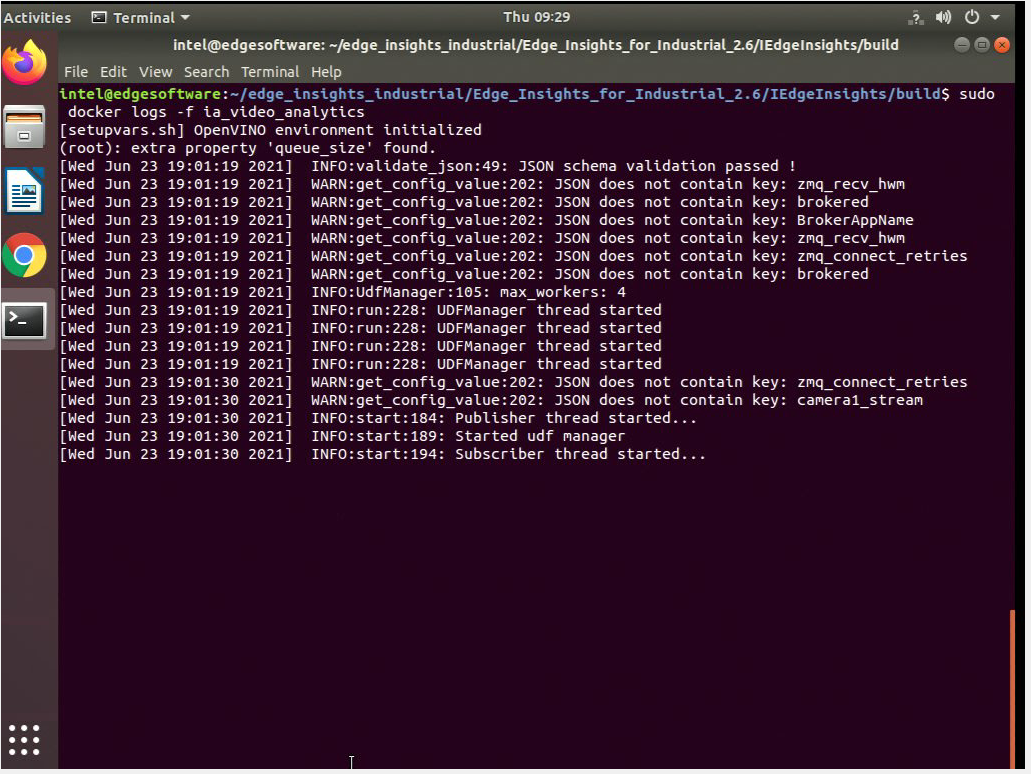
Press Ctrl+C on your keyboard to stop the log file.
NOTE:
You must stop the containers to close the visualizer.
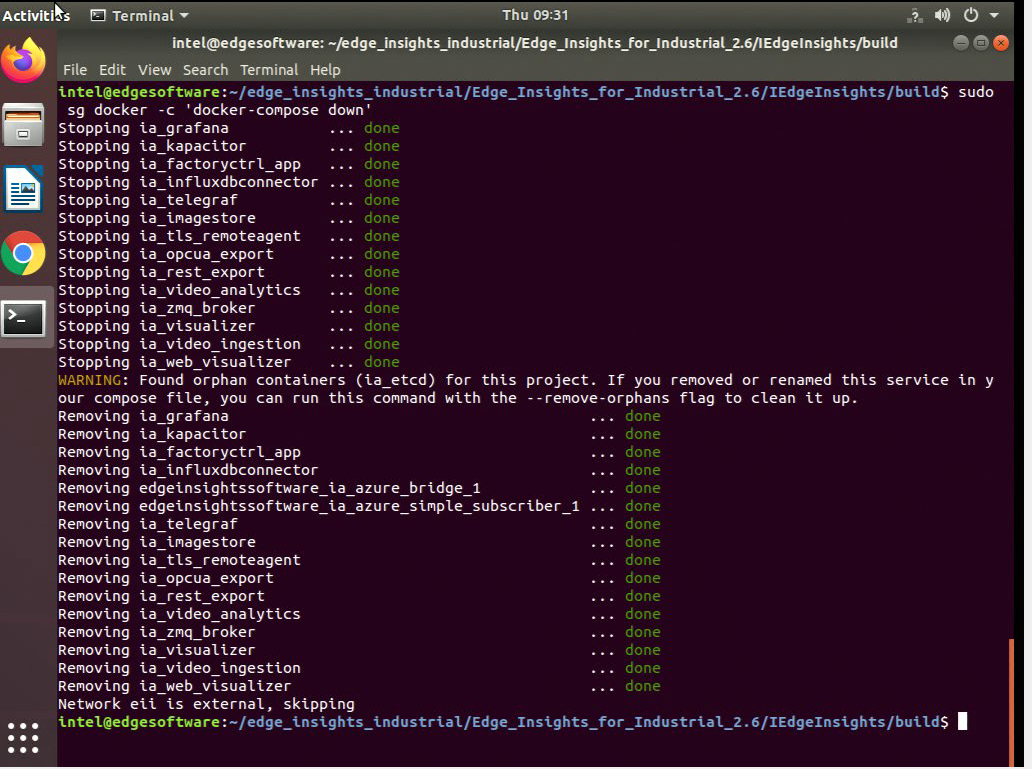
Step 2: Stop the Edge Insights for Industrial Containers
Stop the Edge Insights for Industrial containers:
cd $HOME/edge_insights_industrial/Edge_Insights_for_Industrial_<version>/IEdgeInsights/build
sudo sg docker -c `docker-compose down`
where <version> indicates the downloaded version of Edge Insights for Industrial.
How the PCB Defect Detection Demo Works
Video frames are sent to a Python* application named filter in the Video Ingestion container where unwanted frames are filtered out and frames of interest are passed to a Python application named classifier. The classifier application is also in the Video Analytics container. This container is for deep learning inference via the data bus.
Results are saved to a database and passed to the data bus, which is used by the Visualizer container that runs a sample Python application to display the images on the target system.
Summary and Next Steps
In this tutorial, you learned to start Edge Insights for Industrial and see the results of the demo application as it performed a quality control inspection on a video of PCBs. You also learned how the application works at a high level and are more familiar with its modules and structure. For more Edge Insights for Industrial features/configurations, refer to edge_insights_industrial/Edge_Insights_for_Industrial_<version>/IEdgeInsights/README.md, where <version> indicates the downloaded version of Edge Insights for Industrial.