Visible to Intel only — GUID: GUID-A6E3BE7C-EAB1-4C8C-83AB-0F41406D1A28
Introduction
Install and Launch Intel® Advisor
Set Up Project
Analyze Vectorization Perspective
Analyze CPU Roofline
Model Threading Designs
Model Offloading to a GPU
Analyze GPU Roofline
Design and Analyze Flow Graphs
Minimize Analysis Overhead
Analyze MPI Applications
Manage Results
Command Line Interface
Troubleshooting
Reference
Appendix
Notices and Disclaimers
Annotation Report, Clear Description of Storage Row
Annotation Report, Disable Observations in Region Row
Annotation Report, Pause Collection Row
Annotation Report, Inductive Expression Row
Annotation Report, Lock Row
Annotation Report, Observe Uses Row
Annotation Report, Reduction Row
Annotation Report, Re-enable Observations at End of Region Row
Annotation Report, Resume Collection Row
Annotation Report, Site Row
Annotation Report, Task Row
Annotation Report, User Memory Allocator Use Row
Annotation Report, User Memory Deallocator Use Row
Intel® oneAPI Threading Building Blocks (oneTBB) Mutexes
Intel® oneAPI Threading Building Blocks (oneTBB) Simple Mutex - Example
Test the Intel® oneAPI Threading Building Blocks (oneTBB) Synchronization Code
Parallelize Functions - Intel® oneAPI Threading Building Blocks (oneTBB) Tasks
Parallelize Data - Intel® oneAPI Threading Building Blocks (oneTBB) Counted Loops
Parallelize Data - Intel® oneAPI Threading Building Blocks (oneTBB) Loops with Complex Iteration Control
Add OpenMP Code to Synchronize the Shared Resources
OpenMP Critical Sections
Basic OpenMP Atomic Operations
Advanced OpenMP Atomic Operations
OpenMP Reduction Operations
OpenMP Locks
Test the OpenMP Synchronization Code
Parallelize Functions - OpenMP Tasks
Parallelize Data - OpenMP Counted Loops
Parallelize Data - OpenMP Loops with Complex Iteration Control
Run Offload Modeling Perspective from GUI
Run Offload Modeling Perspective from Command Line
Prerequisites
Optional: Generate pre-Configured Command Lines
Method 1. Use Collection Presets
Method 2. Use per-Analysis Collection
Method 3. Use Python* Scripts
Next Steps
Explore Offload Modeling Results
Advanced Modeling Configuration
Where to Find the Flow Graph Analyzer
Launching the Flow Graph Analyzer
Flow Graph Analyzer GUI Overview
Flow Graph Analyzer Workflows
Designer Workflow
Generating C++ Stubs
Preferences
Scalability Analysis
Collecting Traces from Applications
Nested Parallelism in Flow Graph Analyzer
Analyzer Workflow
Experimental Support for OpenMP* Applications
Sample Trace Files
Additional Resources
accuracy
append
app-working-dir
assume-dependencies
assume-hide-taxes
assume-ndim-dependency
assume-single-data-transfer
auto-finalize
batching
benchmarks-sync
bottom-up
cache-binaries
cache-binaries-mode
cache-config
cache-simulation
cache-sources
cachesim
cachesim-associativity
cachesim-cacheline-size
cachesim-mode
cachesim-sampling-factor
cachesim-sets
check-profitability
clear
config
count-logical-instructions
count-memory-instructions
count-memory-objects-accesses
count-mov-instructions
count-send-latency
cpu-scale-factor
csv-delimiter
custom-config
data-limit
data-reuse-analysis
data-transfer
data-transfer-histogram
data-transfer-page-size
data-type
delete-tripcounts
disable-fp64-math-optimization
display-callstack
dry-run
duration
dynamic
enable-cache-simulation
enable-data-transfer-analysis
enable-task-chunking
enforce-baseline-decomposition
enforce-fallback
enforce-offloads
estimate-max-speedup
evaluate-min-speedup
exclude-files
executable-of-interest
exp-dir
filter
filter-by-scope
filter-reductions
flop
force-32bit-arithmetics
force-64bit-arithmetics
format
gpu
gpu-carm
gpu-sampling-interval
hide-data-transfer-tax
ignore
ignore-app-mismatch
ignore-checksums
instance-of-interest
integrated
interval
limit
loop-call-count-limit
loop-filter-threshold
loops
mark-up
mark-up-list
memory-level
memory-operation-type
mix
mkl-user-mode
model-baseline-gpu
model-children
model-extended-math
model-system-calls
module-filter
module-filter-mode
mpi-rank
mrte-mode
ndim-depth-limit
option-file
overlap-taxes
pack
profile-gpu
profile-intel-perf-libs
profile-jit
profile-python
profile-stripped-binaries
project-dir
quiet
recalculate-time
record-mem-allocations
record-stack-frame
reduce-lock-contention
reduce-lock-overhead
reduce-site-overhead
reduce-task-overhead
refinalize-survey
remove
report-output
report-template
result-dir
resume-after
return-app-exitcode
search-dir
search-n-dim
select
set-dependency
set-parallel
set-parameter
show-all-columns
show-all-rows
show-functions
show-loops
show-not-executed
show-report
small-node-filter
sort-asc
sort-desc
spill-analysis
stack-access-granularity
stack-stitching
stack-unwind-limit
stacks
stackwalk-mode
start-paused
static-instruction-mix
strategy
support-multi-isa-binaries
target-device
target-gpu
target-pid
target-process
target-system
threading-model
threads
top-down
trace-mode
trace-mpi
track-memory-objects
track-stack-accesses
track-stack-variables
trip-counts
verbose
with-stack
Error Message: Application Sets Its Own Handler for Signal
Error Message: Cannot Collect GPU Hardware Metrics for the Selected GPU Adapter
Error Message: Memory Model Cache Hierarchy Incompatible
Error Message: No Annotations Found
Error Message: No Data Is Collected
Error Message: Stack Size Is Too Small
Error Message: Undefined Linker References to dlopen or dlsym
Problem: Broken Call Tree
Problem: Code Region is not Marked Up
Problem: Debug Information Not Available
Problem: No Data
Problem: Source Not Available
Problem: Stack in the Top-Down Tree Window Is Incorrect
Problem: Survey Tool does not Display Survey Report
Problem: Unexpected C/C++ Compilation Errors After Adding Annotations
Problem: Unexpected Unmatched Annotations in the Dependencies Report
Warning: Analysis of Debug Build
Warning: Analysis of Release Build
Dangling Lock
Data Communication
Data Communication, Child Task
Inconsistent Lock Use
Lock Hierarchy Violation
Memory Reuse
Memory Reuse, Child Task
Memory Watch
Missing End Site
Missing End Task
Missing Start Site
Missing Start Task
No Tasks in Parallel Site
One Task Instance in Parallel Site
Orphaned Task
Parallel Site Information
Thread Information
Unhandled Application Exception
Dialog Box: Corresponding Command Line
Dialog Box: Create a Project
Dialog Box: Create a Result Snapshot
Dialog Box: Options - Assembly
Editor Tab
Dialog Box: Options - General
Dialog Box: Options - Result Location
Dialog Box: Project Properties - Analysis Target
Dialog Box: Project Properties - Binary/Symbol Search
Dialog Box: Project Properties - Source Search
Pane: Advanced View
Pane: Analysis Workflow
Pane: Roofline Chart
Pane: GPU Roofline Chart
Project Navigator Pane
Toolbar: Intel Advisor
Annotation Report
Window: Dependencies Source
Window: GPU Roofline Regions
Window: GPU Roofline Insights Summary
Window: Memory Access Patterns Source
Window: Offload Modeling Summary
Window: Offload Modeling Report - Accelerated Regions
Window: Perspective Selector
Window: Refinement Reports
Window: Suitability Report
Window: Suitability Source
Window: Survey Report
Window: Survey Source
Window: Threading Summary
Window: Vectorization Summary
Visible to Intel only — GUID: GUID-A6E3BE7C-EAB1-4C8C-83AB-0F41406D1A28
Run Offload Modeling Perspective from Command Line
Intel® Advisor provides several methods to run the Offload Modeling perspective from command line. Use one of the following:
- Method 1. Run Offload Modeling with a command line collection presets. Use this method if you want to use basic Intel Advisor analysis and modeling functionality, especially for the first-run analysis. This simple method allows you to run multiple analyses with a single command and control the modeling accuracy.
- Method 2. Run Offload Modeling analyses separately. Use this method if you want to analyze an MPI application or need more advanced analysis customization. This method allows you to select what performance data you want to collect for your application and configure each analysis separately.
- Method 3. Run Offload Modeling with Python* scripts. Use this method if you need more analysis customization. This method is moderately flexible and allows you to customize data collection and performance modeling steps.
TIP:
See Intel Advisor cheat sheet for quick reference on command line interface.
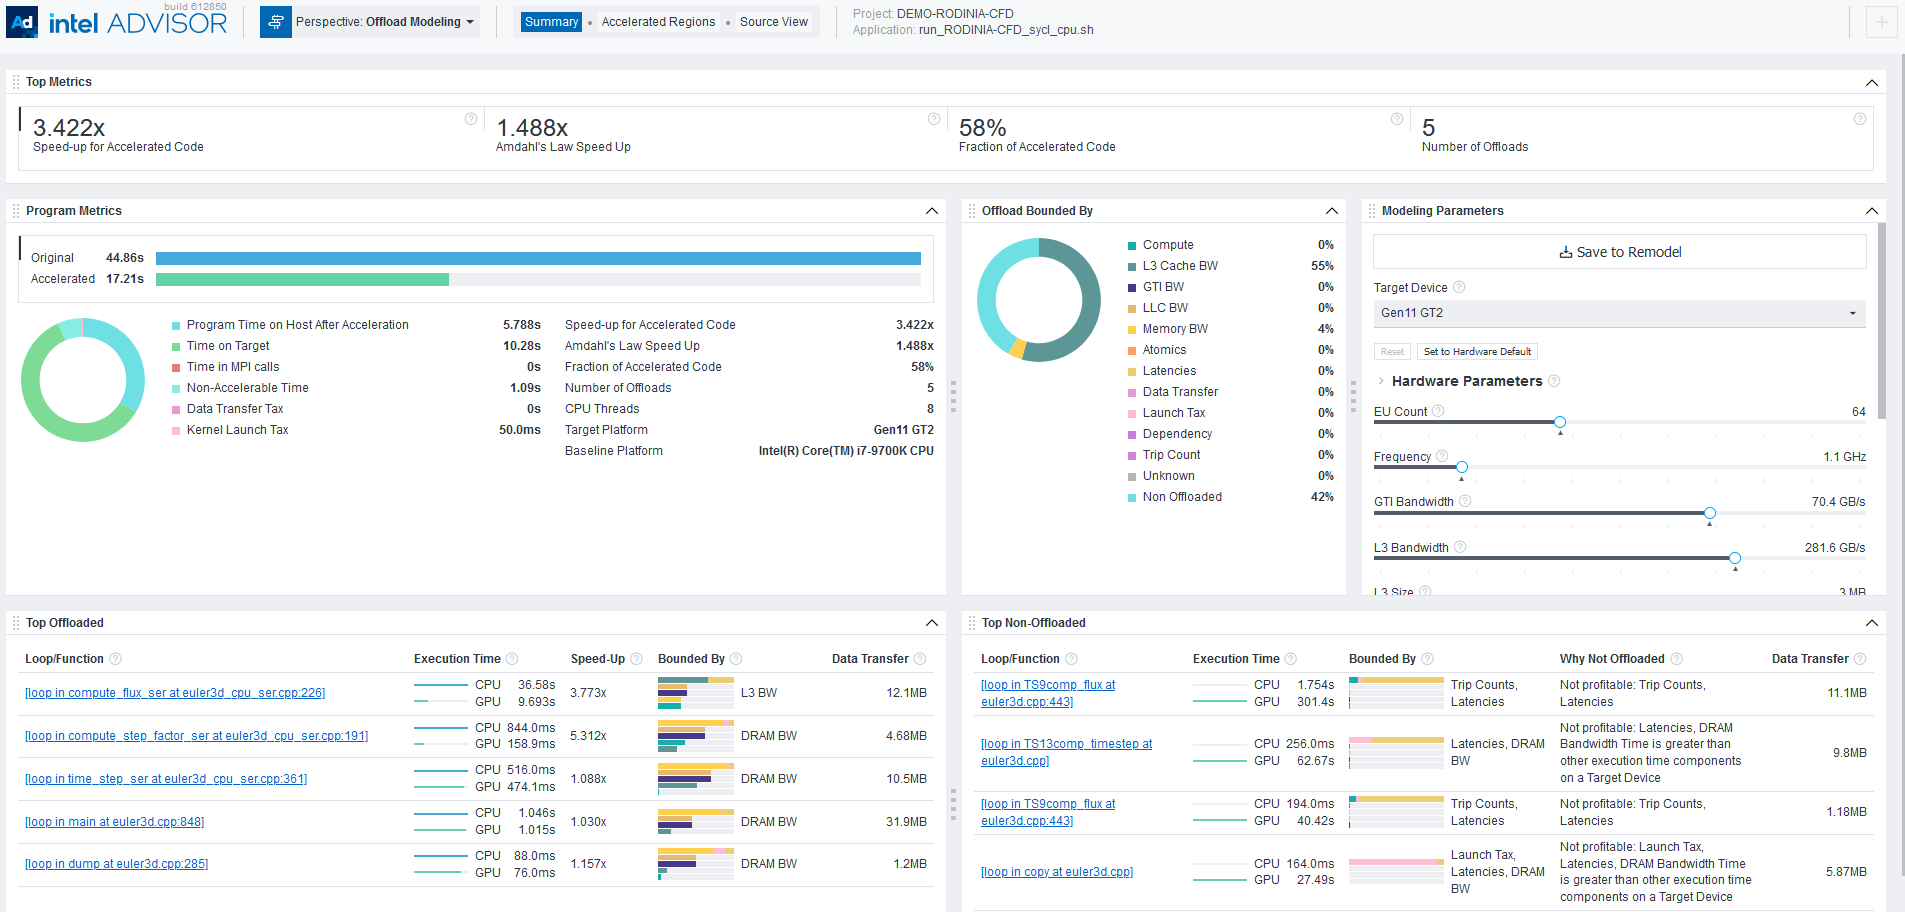
After you run the Offload Modeling with any method above, you can view the results in Intel Advisor graphical user interface (GUI), command line interface (CLI), or an interactive HTML report. For example, the interactive HTML report is similar to the following:
Prerequisites
- Set Intel Advisor environment variables with an automated script.
The script enables the advisor command line interface (CLI), advisor-python command line tool, and the APM environment variable, which points to the directory with Offload Modeling scripts and simplifies their use.
- For SYCL, OpenMP* target, OpenCL™ applications: Set Intel Advisor environment variables to offload temporarily your application to a CPU for the analysis.
NOTE:You are recommended to run the GPU-to-GPU performance modeling to analyze SYCL, OpenMP target, and OpenCL application because it provides more accurate estimations.
Optional: Generate pre-Configured Command Lines
With the Intel Advisor, you can generate pre-configured command lines for your application and hardware. Use this feature if you want to:
- Analyze an MPI application
- Customize pre-set Offload Modeling commands
Offload Modeling perspective consists of multiple analysis steps executed for the same application and project. You can configure each step from scratch or use pre-configured command lines that do not require you to provide the paths to project directory and an application executable manually.
Option 1. Generate pre-configured command lines with --collect=offload and the --dry-run option. The option generates:
- Commands for the Intel Advisor CLI collection workflow
- Commands that correspond to a specified accuracy level
- Commands not configured to analyze an MPI application. You need to manually adjust the commands for MPI.
Note: In the commands below, make sure to replace the myApplication with your application executable path and name before executing a command. If your application requires additional command line options, add them after the executable name.
The workflow includes the following steps:
- Generate the command using the --collect=offload action with the --dry-run option. Specify accuracy level and paths to your project directory and application executable.
For example, to generate the low-accuracy commands for the myApplication application, run the following command:
- On Linux* OS:
advisor --collect=offload --accuracy=low --dry-run --project-dir=./advi_results -- ./myApplication - On Windows* OS:
advisor --collect=offload --accuracy=low --dry-run --project-dir=.\advi_results -- .\myApplication.exe
You should see a list of commands for each analysis step to get the Offload Modeling result with the specified accuracy level (for the commands above, it is low).
- On Linux* OS:
- If you analyze an MPI application: Copy the generated commands to your preferred text editor and modify each command to use an MPI tool. For details about the syntax, see Analyze MPI Applications.
- Run the generated commands one by one from a command prompt or a terminal.
Option 2. If you have an Intel Advisor graphical user interface (GUI) available on your system and you want to analyze an MPI application from command line, you can generate the pre-configured command lines from GUI.
The GUI generates:
- Commands for the Intel Advisor CLI collection workflow
- Commands for a selected accuracy level if you want to run a pre-defined accuracy level or commands for a custom project configuration if you want to enable/disable additional analysis options
- Command configured for MPI application with Intel® MPI Library. You do not need to manually modify the commands for the MPI application syntax.
For detailed instructions, see Generate Pre-configured Command Lines.
Method 1. Use Collection Presets
For the Offload Modeling perspective, Intel Advisor has a special collection mode --collect=offload that allows you to run several analyses using only oneIntel Advisor CLI command. When you run the collection, it sequentially runs data collection and performance modeling steps. The specific analyses and options depend on the accuracy level you specify for the collection.
Note: In the commands below, make sure to replace the myApplication with your application executable path and name before executing a command. If your application requires additional command line options, add them after the executable name.
For example, to run the Offload Modeling perspective with the default (medium) accuracy level:
- On Linux* OS:
advisor --collect=offload --project-dir=./advi_results -- ./myApplication - On Windows* OS:
advisor --collect=offload --project-dir=.\advi_results -- .\myApplication.exe
The collection progress and commands for each analysis executed will be printed to a terminal or a command prompt. By default, the performance is modeled for the Intel® Arc™ graphics code-named Alchemist (xehpg_512xve configuration). When the collection is finished, you will see the result summary.
Analysis Details
To change the analyses to run and their option, you can specify a different accuracy level with the --accuracy=<level> option. The default accuracy level is medium.
The following accuracy levels are available:
- low accuracy includes Survey, Characterization with Trip Counts and FLOP collections, and Performance Modeling analyses.
- medium (default) accuracy includes Survey, Characterization with Trip Counts and FLOP collections, cache and data transfer simulation, and Performance Modeling analyses.
- high accuracy includes Survey, Characterization with Trip Counts and FLOP collections, cache, data transfer, and memory object attribution simulation, and Performance Modeling analyses. For CPU applications, also includes the Dependencies analysis.
For CPU applications, this accuracy level adds a high collection overhead because it includes the Dependencies analysis. This analysis is not required if your application is highly parallelized or vectorized on a CPU or if you know that key hotspots in your application do not have loop-carried dependencies. Otherwise, to learn how dependencies might affect your application performance on a GPU, see How Assumed Dependencies Affect Modeling?>.
For example, to run the low accuracy level:
advisor --collect=offload --accuracy=low --project-dir=./advi_results -- ./myApplicationTo run the high accuracy level:
advisor --collect=offload --accuracy=high --project-dir=./advi_results -- ./myApplicationIf you want to see the commands that are executed at each accuracy level, you can run the collection with the --dry-run option. The commands will be printed to a terminal or a command prompt.
For details about each accuracy level, see Offload Modeling Accuracy Levels in Command Line.
Customize Collection
You can also specify additional options if you want to run the Offload Modeling with custom configuration. This collection accepts most options of the Performance Modeling analysis (--collect=projection) and some options of the Survey, Trip Counts, and Dependencies analyses that can be useful for the Offload Modeling.
IMPORTANT:
Make sure to specify the additional options after the --accuracy option to make sure they take precedence over the accuracy level configurations.
Consider the following action options:
Option |
Description |
|---|---|
--accuracy=<level> |
Set an accuracy level for a collection preset. Available accuracy levels:
For details, see Offload Modeling Accuracy Levels in Command Line. |
--config |
Select a target GPU configuration to model performance for. For example, xehpg_512xve (default), gen12_dg1, or gen9_gt3. See conig for a full list of possible values and mapping to device names. |
--gpu |
Analyze a SYCL, OpenCL™, or OpenMP* target application on a graphics processing unit (GPU) device. This option automatically adds all related options to each analysis included in the preset. If you use this option, the high accuracy does not include the Dependencies analysis. For details about this workflow, see Run GPU-to-GPU Performance Modeling from Command Line. |
--data-reuse-analysis |
Analyze potential data reuse between code regions. This option automatically adds all related options to each analysis included in the preset. |
--enforce-fallback |
Emulate data distribution over stacks if stacks collection is disabled. This option automatically adds all related options to each analysis included in the preset. |
For details about other available options, see collect.
Method 2. Use per-Analysis Collection
You can collect data and model performance for your application by running each Offload Modeling analysis in a separate command using Intel Advisor CLI. This option allows you to:
- Control what analyses you want to run to profile your application and what data you want to collect
- Modify behavior of each analysis you run with an extensive set of options
- Remodel application performance without re-collecting performance data. This can save time if you want to see how the performance of your application might change with different modeling parameters using the same performance data as baseline
- Profile and model performance of an MPI application
Consider the following workflow example. Using this example, you can run the Survey, Trip Counts, and FLOP analyses to profile an application and the Performance Modeling to model its performance on a selected target device.
Note: In the commands below, make sure to replace the myApplication with your application executable path and name before executing a command. If your application requires additional command line options, add them after the executable name.
On Linux OS:
- Run the Survey analysis.
advisor --collect=survey --static-instruction-mix --project-dir=./advi_results -- ./myApplication - Run the Trip Counts and FLOP analyses with data transfer simulation for the default Intel® Arc™ graphics code-named Alchemist (xehpg_512xve configuration).
advisor --collect=tripcounts --flop --stacks --cache-simulation=single --target-device=xehpg_512xve --data-transfer=light --project-dir=./advi_results -- ./myApplication - Optional: Run the Dependencies analysis to check for loop-carried dependencies.
advisor -collect=dependencies --loop-call-count-limit=16 --select markup=gpu_generic --filter-reductions --project-dir=./advi_results -- ./myApplicationThe Dependencies analysis adds a high collection overhead. You can skip it if your application is highly parallelized or vectorized on a CPU or if you know that key hotspots in your application do not have loop-carried dependencies.. If you are not sure, see Check How Assumed Dependencies Affect Modeling to learn how dependencies affect your application performance on a GPU.
- Run the Performance Modeling analysis to model application performance on the default Intel® Arc™ graphics code-named Alchemist(xehpg_512xve configuration).
advisor --collect=projection --project-dir=./advi_resultsYou will see the result summary printed to the command prompt.
Tip: If you already have an analysis result saved as a snapshot or a result for an MPI rank, you can use the exp-dir option instead of project-dir to model performance for the result.
On Windows OS:
- Run the Survey analysis.
advisor --collect=survey --static-instruction-mix --project-dir=.\advi_results -- .\myApplication.exe - Run the Trip Counts and FLOP analyses with cache simulation for the default Intel® Arc™ graphics code-named Alchemist (xehpg_512xve configuration).
advisor --collect=tripcounts --flop --stacks --cache-simulation=single --target-device=xehpg_512xve --data-transfer=light --project-dir=.\advi_results -- .\myApplication.exe - Optional: Run the Dependencies analysis to check for loop-carried dependencies.
advisor -collect=dependencies --loop-call-count-limit=16 --select markup=gpu_generic --filter-reductions --project-dir=.\advi_results -- myApplication.exeThe Dependencies analysis adds a high collection overhead. You can skip it if your application is highly parallelized or vectorized on a CPU or if you know that key hotspots in your application do not have loop-carried dependencies.. If you are not sure, see Check How Assumed Dependencies Affect Modeling to learn how dependencies affect your application performance on a GPU.
- Run the Performance Modeling analysis to model application performance on the default Intel® Arc™ graphics code-named Alchemist (xehpg_512xve configuration).
advisor --collect=projection --project-dir=.\advi_resultsYou will see the result summary printed to the command prompt.
Tip: If you already have a collected analysis result saved as a snapshot or result for an MPI rank, you can use the exp-dir option instead of project-dir to model performance for the result.
For more useful options, see the Analysis Details section below.
Analysis Details
The Offload Modeling workflow includes the following analyses:
- Survey to collect initial performance data.
- Characterization with trip counts and FLOP to collect performance details.
- Dependencies (optional) to identify loop-carried dependencies that might limit offloading.
- Performance Modeling to model performance on a selected target device.
Each analysis has a set of additional options that modify its behavior and collect additional performance data. The more analyses you run and option you use, the higher the modeling accuracy.
Consider the following options:
Survey Options
To run the Survey analysis, use the following command line action: --collect=survey.
Recommended action options:
Options |
Description |
|---|---|
--static-instruction-mix |
Collect static instruction mix data. This option is recommended for the Offload Modeling perspective. |
--profile-gpu |
Analyze a SYCL, OpenCL, or OpenMP target application on a GPU device. If you use this option, skip the Dependencies analysis. For details about this workflow, see Run GPU-to-GPU Performance Modeling from Command Line. |
Characterization Options
To run the Characterization analysis, use the following command line action: --collect=tripcounts.
Recommended action options:
Options |
Description |
|---|---|
--flop |
Collect data about floating-point and integer operations, memory traffic, and mask utilization metrics for AVX-512 platforms. |
--stacks |
Enable advanced collection of call stack data. |
--cache-simulation=<mode> |
Simulate cache behavior for a target device. Available modes:
|
--target-device=<target> |
Specify a target graphics processing unit (GPU) to model cache for. For example, xehpg_512xve (default), gen12_dg1, or gen9_gt3. See target-device for a full list of possible values and mapping to device names. Use with the --cache-simulation=single option.
IMPORTANT:
Make sure to specify the same target device as for the --collect=projection --config=<config>.
|
--data-transfer=<mode> |
Enable modeling data transfers between host and target devices. The following modes are available:
|
--profile-gpu |
Analyze a SYCL, OpenCL, or OpenMP target application on a GPU device. If you use this option, skip the Dependencies analysis. For details about this workflow, see Run GPU-to-GPU Performance Modeling from Command Line. |
Dependencies Options
The Dependencies analysis is optional because it adds a high overhead and is mostly necessary if you have scalar loops/functions in your application or if you do not know about loop-carried dependencies in key hotspots. For details about when you need to run the Dependencies analysis, see Check How Assumed Dependencies Affect Modeling.
To run the Dependencies analysis, use the following command line action: --collect=dependencies.
Recommended action options:
Options |
Description |
|---|---|
--select=<string> |
Select loops to run the analysis for. For the Offload Modeling, the recommended value is --select markup=gpu_generic, which selects only loops/functions profitable for offloading to a target device to reduce the analysis overhead. For more information about markup options, see Loop Markup to Minimize Analysis Overhead.
NOTE:
The generic markup strategy is recommended if you want to run the Dependencies analysis for an application that does not use SYCL, C++/Fortran with OpenMP target, or OpenCL.
|
--loop-call-count-limit=<num> |
Set the maximum number of call instances to analyze assuming similar runtime properties over different call instances. The recommended value is 16. |
--filter-reductions |
Mark all potential reductions with a specific diagnostic. |
Performance Modeling Options
To run the Performance Modeling analysis, use the following command line action: --collect=projection.
Recommended action options:
Options |
Description |
|---|---|
--exp-dir=<path> |
Specify a path to an unpacked result snapshot or an MPI rank result to model performance. Use this option instead of project-dir if you already have an analysis result ready. |
--config=<config> |
Select a target GPU configuration to model performance for. For example, xehpg_512xve (default), gen12_dg1, or gen9_gt3.
IMPORTANT:
Make sure to specify the same target device as for the --collect=tripcounts --target-device=<target>.
For details about configuration files, see config. |
--no-assume-dependencies |
Assume that a loop does not have dependencies if a loop dependency type is unknown. Use this option if your application contains parallel and/or vectorized loops and you did not run the Dependencies analysis. |
--data-reuse-analysis |
Analyze potential data reuse between code regions when offloaded to a target GPU.
IMPORTANT:
Make sure to use --data-transfer=full with --collect=tripcounts for this option to work correctly.
|
--assume-hide-taxes |
Assume that an invocation tax is paid only for the first time a kernel is launched. |
--set-parameter |
Specify a single-line configuration parameter to modify in a format "<group>.<parameter>=<new-value>". For example, "min_required_speed_up=0". For details about the option, see set-parameter. For details about some of the possible modifications, see Advanced Modeling Configuration. |
--profile-gpu |
Analyze a SYCL, OpenCL, or OpenMP target application on a GPU device. If you use this option, skip the Dependencies analysis. For details about this workflow, see Run GPU-to-GPU Performance Modeling from Command Line. |
See advisor Command Option Reference for more options.
Method 3. Use Python* Scripts
Intel Advisor has three scripts that use the Intel Advisor Python* API to run the Offload Modeling. You can run the scripts with the advisor-python command line tool or with your local Python 3.6 or 3.7.
The scripts vary in functionality and run different sets of Intel Advisor analyses. Depending on what you want to run, use one or several of the following scripts:
- run_oa.py is the simplest script with limited modification flexibility. Use this script to run the collection and modeling steps with a single command. This script is the equivalent of the Intel Advisor command line collection preset.
- collect.py is a moderately flexible script that runs only the collection step.
- analyze.py is a moderately flexible script that runs only the performance modeling step.
NOTE:
The scripts do not support the analysis of MPI applications. For an MPI application, use the per-analysis collection with the Intel Advisor CLI.
You can run the Offload Modeling using different combinations of the scripts and/or the Intel Advisor CLI. For example:
- Run run_oa.py to profile application and model its performance.
- Run the collect.py to profile application and analyze.py to model its performance. Re-run analyze.py to remodel with a different configuration.
- Run the Intel Advisor CLI to collect performance data and analyze.py to model performance. Re-run analyze.py to remodel with a different configuration.
- Run run_oa.py to collect data and model performance for the first time and run analyze.py to remodel with a different configuration.
Consider the following examples of some typical scenarios with Python scripts.
Note: In the commands below, make sure to replace the myApplication with your application executable path and name before executing a command. If your application requires additional command line options, add them after the executable name.
Example 1. Run the run_oa.py script to profile an application and model its performance for the Intel® ™ graphics code-named Alchemist (xehpg_512xve configuration).
- On Linux OS:
advisor-python $APM/run_oa.py ./advi_results --collect=basic --config=xehpg_512xve -- ./myApplication - On Windows OS:
advisor-python %APM%\run_oa.py .\advi_results --collect=basic --config=xehpg_512xve -- .\myApplication.exe
You will see the result summary printed to the command prompt.
For more useful options, see the Analysis Details section below.
Example 2. Run the collect.py to profile an application and run the analyze.py to model its performance for the Intel® Arc™ graphics code-named Alchemist (xehpg_512xve configuration).
- On Linux OS:
- Collect performance data.
advisor-python $APM/collect.py ./advi_results --collect=basic --config=xehpg_512xve -- ./myApplication - Model application performance.
advisor-python $APM/analyze.py ./advi_results --config=xehpg_512xve
You will see the result summary printed to the command prompt.
- Collect performance data.
- On Windows OS:
- Collect performance data.
advisor-python %APM%\collect.py .\advi_results --collect=basic --config=xehpg_512xve -- .\myApplication.exe - Model application performance.
advisor-python %APM%\analyze.py .\advi_results --config=xehpg_512xve
- Collect performance data.
For more useful options, see the Analysis Details section below.
Analysis Details
Each script has a set of additional options that modify its behavior and collect additional performance data. The more analyses you run and options you use, the higher the modeling accuracy.
Collection Options
The following options are applicable to the run_oa.py and collect.py scripts.
Option |
Description |
|---|---|
--collect=<mode> |
Specify data to collect for your application:
See Check How Assumed Dependencies Affect Modeling to learn when you need to collect dependency data. |
--config=<config> |
Select a target GPU configuration to model performance for. For example, xehpg_512xve (default), gen12_dg1, or gen9_gt3.
IMPORTANT:
For collect.py, make sure to specify the same value of the --config option for the analyze.py.
For details about configuration files, see config. |
--markup=<markup-mode> |
Select loops to collect Trip Counts and FLOP and/or Dependencies data for with a pre-defined markup algorithm. This option decreases collection overhead. By default, it is set to generic to analyze all loops profitable for offloading. |
--gpu |
Analyze a SYCL, OpenCL, or OpenMP target application on a GPU device. For details about this workflow, see Run GPU-to-GPU Performance Modeling from Command Line. |
For a full list of available options, see:
Performance Modeling Options
The following options are applicable to the run_oa.py and analyze.py scripts.
Option |
Description |
|---|---|
--config=<config> |
Select a target GPU configuration to model performance for. For example, xehpg_512xve (default), gen12_dg1, or gen9_gt3.
IMPORTANT:
For analyze.py, make sure to specify the same value of the --config option for the collect.py.
For details about configuration files, see config. |
--assume-parallel |
Assume that a loop does not have dependencies if there is no information about the loop dependency type and you did not run the Dependencies analysis. |
--data-reuse-analysis |
Analyze potential data reuse between code regions when offloaded to a target GPU.
IMPORTANT:
Make sure to use --collect=full when running the analyses with collect.py or use the --data-transfer=full when running the Trip Counts analysis with Intel Advisor CLI.
|
--gpu |
Analyze a SYCL, OpenCL, or OpenMP target application on a GPU device. For details about this workflow, see Run GPU-to-GPU Performance Modeling from Command Line. |
For a full list of available options, see:
Next Steps
Continue to explore the Offload Modeling results with a preferred method. For details about the metrics reported, see Accelerator Metrics.
Parent topic: Model Offloading to a GPU
- Offload Modeling Accuracy Levels in Command Line
- Run GPU-to-GPU Performance Modeling from Command Line
With Intel® Advisor, you can model performance of SYCL, OpenCL™, or OpenMP* target application running on a graphics processing unit (GPU) for a different GPU device without its CPU version. For this, run the GPU-to-GPU modeling workflow of the Offload Modeling perspective.
See Also
Model Offloading to a GPU Find high-impact opportunities to offload/run your code and identify potential performance bottlenecks on a target graphics processing unit (GPU) by running the Offload Modeling perspective.
Command Line Interface This reference section describes the Intel® Advisor command line interface (CLI) used to run the analysis.
Model MPI Application Performance on GPU You can model your MPI application performance on a target graphics processing unit (GPU) device to determine whether you can get a performance speedup from offloading the application to the GPU.