Visible to Intel only — GUID: GUID-20484777-1757-4B27-8B50-55DDCB7D3C2C
Introduction
Install and Launch Intel® Advisor
Set Up Project
Analyze Vectorization Perspective
Analyze CPU Roofline
Model Threading Designs
Model Offloading to a GPU
Analyze GPU Roofline
Design and Analyze Flow Graphs
Minimize Analysis Overhead
Analyze MPI Applications
Manage Results
Command Line Interface
Troubleshooting
Reference
Appendix
Notices and Disclaimers
Annotation Report, Clear Description of Storage Row
Annotation Report, Disable Observations in Region Row
Annotation Report, Pause Collection Row
Annotation Report, Inductive Expression Row
Annotation Report, Lock Row
Annotation Report, Observe Uses Row
Annotation Report, Reduction Row
Annotation Report, Re-enable Observations at End of Region Row
Annotation Report, Resume Collection Row
Annotation Report, Site Row
Annotation Report, Task Row
Annotation Report, User Memory Allocator Use Row
Annotation Report, User Memory Deallocator Use Row
Intel® oneAPI Threading Building Blocks (oneTBB) Mutexes
Intel® oneAPI Threading Building Blocks (oneTBB) Simple Mutex - Example
Test the Intel® oneAPI Threading Building Blocks (oneTBB) Synchronization Code
Parallelize Functions - Intel® oneAPI Threading Building Blocks (oneTBB) Tasks
Parallelize Data - Intel® oneAPI Threading Building Blocks (oneTBB) Counted Loops
Parallelize Data - Intel® oneAPI Threading Building Blocks (oneTBB) Loops with Complex Iteration Control
Add OpenMP Code to Synchronize the Shared Resources
OpenMP Critical Sections
Basic OpenMP Atomic Operations
Advanced OpenMP Atomic Operations
OpenMP Reduction Operations
OpenMP Locks
Test the OpenMP Synchronization Code
Parallelize Functions - OpenMP Tasks
Parallelize Data - OpenMP Counted Loops
Parallelize Data - OpenMP Loops with Complex Iteration Control
Where to Find the Flow Graph Analyzer
Launching the Flow Graph Analyzer
Flow Graph Analyzer GUI Overview
Flow Graph Analyzer Workflows
Designer Workflow
Generating C++ Stubs
Preferences
Scalability Analysis
Collecting Traces from Applications
Nested Parallelism in Flow Graph Analyzer
Analyzer Workflow
Experimental Support for OpenMP* Applications
Sample Trace Files
Additional Resources
accuracy
append
app-working-dir
assume-dependencies
assume-hide-taxes
assume-ndim-dependency
assume-single-data-transfer
auto-finalize
batching
benchmarks-sync
bottom-up
cache-binaries
cache-binaries-mode
cache-config
cache-simulation
cache-sources
cachesim
cachesim-associativity
cachesim-cacheline-size
cachesim-mode
cachesim-sampling-factor
cachesim-sets
check-profitability
clear
config
count-logical-instructions
count-memory-instructions
count-memory-objects-accesses
count-mov-instructions
count-send-latency
cpu-scale-factor
csv-delimiter
custom-config
data-limit
data-reuse-analysis
data-transfer
data-transfer-histogram
data-transfer-page-size
data-type
delete-tripcounts
disable-fp64-math-optimization
display-callstack
dry-run
duration
dynamic
enable-cache-simulation
enable-data-transfer-analysis
enable-task-chunking
enforce-baseline-decomposition
enforce-fallback
enforce-offloads
estimate-max-speedup
evaluate-min-speedup
exclude-files
executable-of-interest
exp-dir
filter
filter-by-scope
filter-reductions
flop
force-32bit-arithmetics
force-64bit-arithmetics
format
gpu
gpu-carm
gpu-sampling-interval
hide-data-transfer-tax
ignore
ignore-app-mismatch
ignore-checksums
instance-of-interest
integrated
interval
limit
loop-call-count-limit
loop-filter-threshold
loops
mark-up
mark-up-list
memory-level
memory-operation-type
mix
mkl-user-mode
model-baseline-gpu
model-children
model-extended-math
model-system-calls
module-filter
module-filter-mode
mpi-rank
mrte-mode
ndim-depth-limit
option-file
overlap-taxes
pack
profile-gpu
profile-intel-perf-libs
profile-jit
profile-python
profile-stripped-binaries
project-dir
quiet
recalculate-time
record-mem-allocations
record-stack-frame
reduce-lock-contention
reduce-lock-overhead
reduce-site-overhead
reduce-task-overhead
refinalize-survey
remove
report-output
report-template
result-dir
resume-after
return-app-exitcode
search-dir
search-n-dim
select
set-dependency
set-parallel
set-parameter
show-all-columns
show-all-rows
show-functions
show-loops
show-not-executed
show-report
small-node-filter
sort-asc
sort-desc
spill-analysis
stack-access-granularity
stack-stitching
stack-unwind-limit
stacks
stackwalk-mode
start-paused
static-instruction-mix
strategy
support-multi-isa-binaries
target-device
target-gpu
target-pid
target-process
target-system
threading-model
threads
top-down
trace-mode
trace-mpi
track-memory-objects
track-stack-accesses
track-stack-variables
trip-counts
verbose
with-stack
Error Message: Application Sets Its Own Handler for Signal
Error Message: Cannot Collect GPU Hardware Metrics for the Selected GPU Adapter
Error Message: Memory Model Cache Hierarchy Incompatible
Error Message: No Annotations Found
Error Message: No Data Is Collected
Error Message: Stack Size Is Too Small
Error Message: Undefined Linker References to dlopen or dlsym
Problem: Broken Call Tree
Problem: Code Region is not Marked Up
Problem: Debug Information Not Available
Problem: No Data
Problem: Source Not Available
Problem: Stack in the Top-Down Tree Window Is Incorrect
Problem: Survey Tool does not Display Survey Report
Problem: Unexpected C/C++ Compilation Errors After Adding Annotations
Problem: Unexpected Unmatched Annotations in the Dependencies Report
Warning: Analysis of Debug Build
Warning: Analysis of Release Build
Dangling Lock
Data Communication
Data Communication, Child Task
Inconsistent Lock Use
Lock Hierarchy Violation
Memory Reuse
Memory Reuse, Child Task
Memory Watch
Missing End Site
Missing End Task
Missing Start Site
Missing Start Task
No Tasks in Parallel Site
One Task Instance in Parallel Site
Orphaned Task
Parallel Site Information
Thread Information
Unhandled Application Exception
Dialog Box: Corresponding Command Line
Dialog Box: Create a Project
Dialog Box: Create a Result Snapshot
Dialog Box: Options - Assembly
Editor Tab
Dialog Box: Options - General
Dialog Box: Options - Result Location
Dialog Box: Project Properties - Analysis Target
Dialog Box: Project Properties - Binary/Symbol Search
Dialog Box: Project Properties - Source Search
Pane: Advanced View
Pane: Analysis Workflow
Pane: Roofline Chart
Pane: GPU Roofline Chart
Project Navigator Pane
Toolbar: Intel Advisor
Annotation Report
Window: Dependencies Source
Window: GPU Roofline Regions
Window: GPU Roofline Insights Summary
Window: Memory Access Patterns Source
Window: Offload Modeling Summary
Window: Offload Modeling Report - Accelerated Regions
Window: Perspective Selector
Window: Refinement Reports
Window: Suitability Report
Window: Suitability Source
Window: Survey Report
Window: Survey Source
Window: Threading Summary
Window: Vectorization Summary
Visible to Intel only — GUID: GUID-20484777-1757-4B27-8B50-55DDCB7D3C2C
Vectorization Report Overview
Review the controls available in the main report of the Vectorization and Code Insights perspective of the Intel® Advisor.
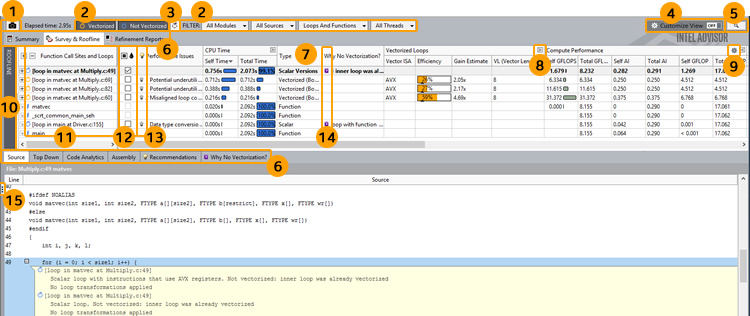
There are many controls available to help you focus on the data most important to you, including the following:
1 |
Click the control to save a read-only result snapshot you can view any time. Intel Advisor stores only the most recent analysis result. Visually comparing one or more snapshots to each other or to the most recent analysis result can be an effective way to judge performance improvement progress. To open a snapshot, choose File > Open > Result... |
|
2 |
Click the various Filter controls to temporarily limit displayed data based on your criteria. |
|
3 |
Click the control to view loops in non-executed code paths for various instruction set architectures (ISAs). Prerequisites:
|
|
4 |
This toggle control currently combines two features: The View Configurator and the Smart Mode filter.
|
|
5 |
Click the button to search for specific data. |
|
6 |
Click the tab to open various Intel Advisor reports or views. |
|
7 |
Right-click a column header to:
|
|
8 |
Click the toggle to show all available columns in a column set, and resume showing a limited number of preset columns in a column set. |
|
9 |
Click the control to:
For example, click the control in the Compute Performance column set to:
|
|
10 |
Click the control to show/hide a chart that helps you visualize actual performance against hardware-imposed performance ceilings, as well as determine the main limiting factor (memory bandwidth or compute capacity), thereby providing an ideal roadmap of potential optimization steps. |
|
11 |
Click a data row in the top of the Survey Report to display more data specific to that row in the bottom of the Survey Report. Double-click a loop data row to display a Survey Source window. To more easily identify data rows of interest:
|
|
12 |
Click a checkbox to mark a loop for deeper analysis. |
|
13 |
If present, click the image to display code-specific how-can-I-fix-this-issue? information in the Recommendations pane. |
|
14 |
If present, click the image to view the reason automatic compiler vectorization failed in the Why No Vectorization? pane. |
|
15 |
Click the control to show/hide the Workflow pane. |
|
 = Vectorized function
  = Vectorized loop
  = Scalar function
  = Scalar loop
 Parent topic: Explore Vectorization and Code Insights Results