How Industrial Edge Insights Software Works
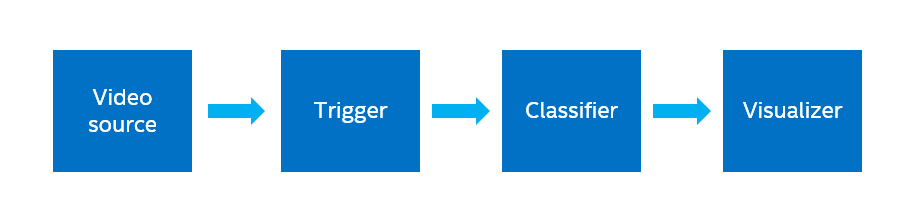
Here is how the Industrial Edge Insights framework is structured for an application in general.
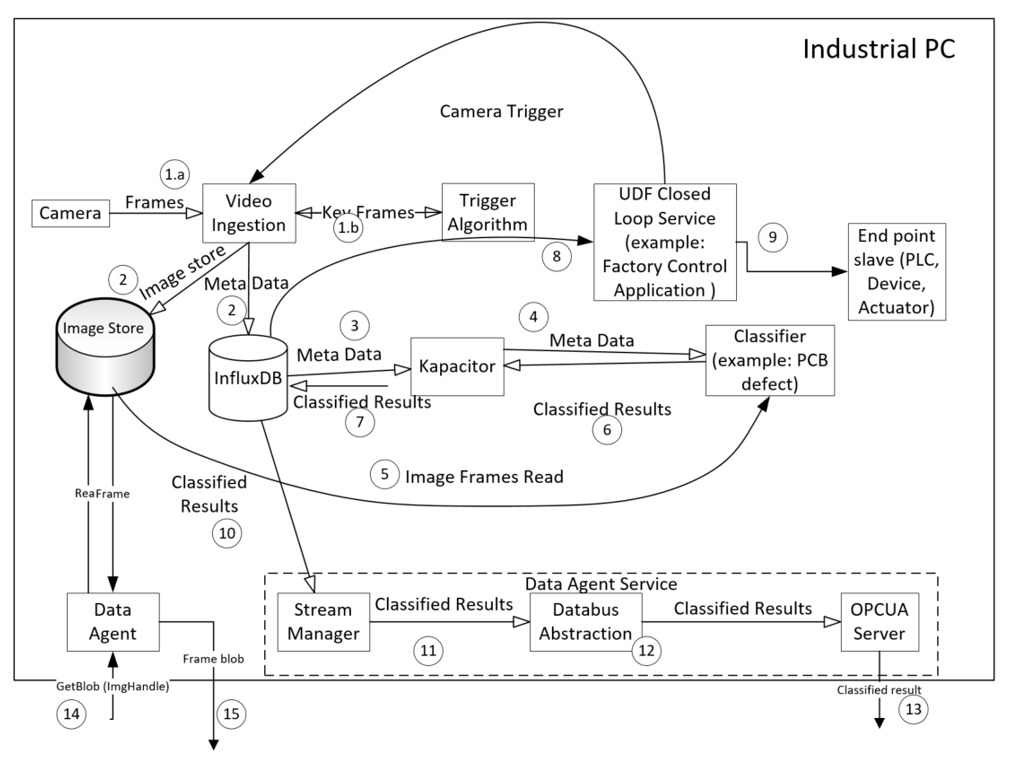
The configuration of an application is controlled by a json file (factory.json below). It is not shown in the diagram above.
factory.json
Location: ~/IEdgeInsights/docker_setup/config/factory.json
Purpose: This file is the main configuration file for the entire work stream. In it, a user can define the data ingestion, storage, triggers, and classifiers. It uses a standard JSON format.
Trigger
Location: ~/IEdgeInsights /algos/dpm/triggers/
Purpose: The trigger Python* script is a filter for the incoming data stream, mainly to reduce the storage and computation requirements by only passing on frames of interest. All input frames are passed to the Trigger (1.b in the diagram above). When it detects a frame of interest based on user defined functions, it activates a signal (1.b) which causes that frame to be saved in the Image Store database (2), and the metadata for that frame in the InfluxDB* database (2).
Classifier
Location: ~/IEdgeInsights /algos/dpm/classification/classifiers/
Purpose: The classifier is a user defined algorithm that is run on each frame of interest. Kapacitor*, an open source data processing engine, subscribes to the meta-data stream (3), and the classifier receives the meta-data from Kapacitor (4). The classifier pulls the frame from the Image Store (5), and saves the analysis results as metadata back into the InfluxDB database (6 and 7).
It’s important to note that as an application developer, you do not need to worry about handling the data flow described above from data ingestion to classification. The included software stack using InfluxDB and Kapacitor handle the data movement and storage. In fact, you do not need to specifically include read and write functions to the databases in the Trigger and Classifier scripts, since that is already included in the base class for you.
Data for an HMI can be read through the Data Agent and Data Agent Service.
Getting Started
Follow these steps to begin working with your kit. This guide assumes you've already set up and powered your kit according to the guide included in the box.
You’ll walk through the following basic steps:
- Run a defect detection demo application
- Learn how this application was integrated
By the end of this guide, you will see a demo of the Industrial Edge Insights Platform in a defect detection use case, and you will get an understanding of how this application is integrated into the Industrial Edge Insights Platform.
About the Defection Detection Demo Application
In this demo scenario, Printed Circuit Boards (PCBs) are being inspected for quality control. There are two types of defects being detected: a missing component and a short. Below are examples of how the application classifies each. The video used in this application is located at ~/IEdgeInsights/test_videos/encoded_pcb_d2000.avi This video shows 3 PCBs rotating through the screen.
Missing component:
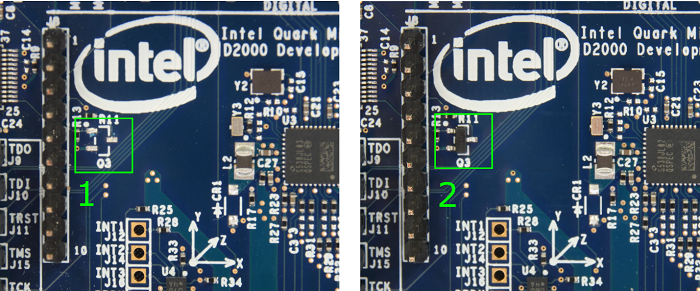
In the image above, #1 is missing a component, and #2 has the component, so it is normal.
Short:
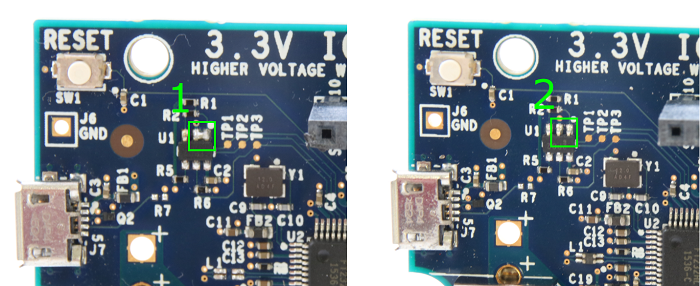
In the image above, #1 has two solder joints connected together that should not be (a short), and #2 is normal.
In the next section, you’ll learn how to launch the Industrial Edge Insights Platform framework which runs the demo.
Step 1: Run a Defect Detection Demo Application
What you’ll learn:
- How to start the Edge Insights Software
- How to visualize the results of the demo application
- How the application works at a high level
At the end of this section, you’ll have a working version of the PCB defect detection application running on your system.
- Connect your system to the internet. The software requires an IP address for the container network configuration and keys.
- Open a terminal and run the following commands:
cd ~/IEdgeInsights/docker_setup
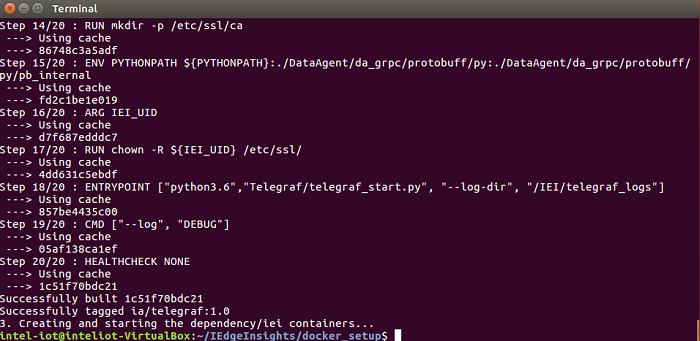
sudo ./compose_startup.sh-The compose_startup.sh script will set up the environment variables, generate the security keys and start all the Docker containers. You should see something like below:
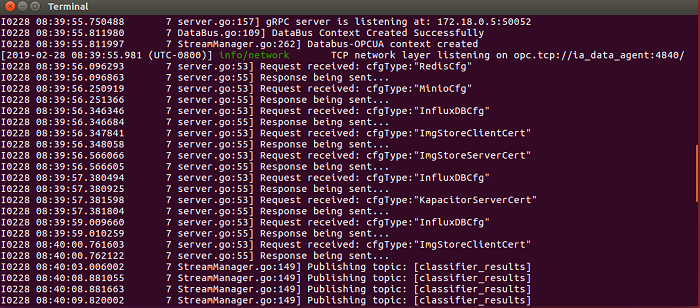
To verify if the data pipeline within Edge Insight is working correctly you can check the log files by entering the following command:
docker logs -f ia_data_agentYou should see messages like “Publishing topic: [classifier_results]”, similar to what is below:
- To terminate the running log file, press Ctrl+Z
How does the PCB defect detection demo work?
- The frames in the sample video are sent to the trigger (it’s ok if you don’t know what the trigger is right now we’ll explain it in the next section).
- The trigger filters out un-needed frames. In this case, it is checking that the PCB board is near the center of the frame.
- Frames of interest are passed on to the classifier, where a deep learning model is used for computer vision inference to determine defects. Defect locations are sent to the database.
This general flow can be followed for almost any computer vision application. Since the Edge Insights Software comes with the framework of data ingestion, analytics, and database infrastructure, it allows you to focus more on writing really good computer vision algorithms (triggers and classifiers) specific to your needs.
Now you’re ready to get hands-on with the Edge Insights Software.
Step 2: Create a Simple Trigger and Classifier
The configuration for the Edge Insight Software is located at ~/IEdgeInsights/docker_setup/config/factory.json. The factory.json contains the algorithm related configurations for ingestion, triggers, and classifiers.
What you’ll learn:
- How to configure the factory.json file to run a new trigger and classifier
- What is inside a simple trigger and classifier
- Before editing the factory.json we will create the copy of the file:
cp config/factory.json config/factory.json.original- Using the gedit editor, modify the factory json file to look like the screenshot below:
gedit config/factory.json{
"machine_id": "tool_2",
"trigger_threads": 1,
"data_ingestion_manager": {
"ingestors": {
"video_file": {
"video_file": "./test_videos/pcb_d2000.avi",
"loop_video": true
}
}
},
"triggers": {
"dummy_trigger": {
}
},
"classification": {
"max_workers": 1,
"classifiers": {
"dummy": {
"trigger": ["dummy_trigger"],
"config":{
}
}
}
}
}
You’ll notice the ./test_videos/pcb_d2000.avi file listed in the “data_ingestion_manager”. This section is where camera or video feeds are configured.
The “triggers” and “classifiers” sections can include user defined parameters, though for the simple trigger and classifier those aren’t needed.
It’s important to note that the trigger and classifier names need to match the names of the Python files, but without the .py extension. For example, dummy_trigger > dummy_trigger.py .
- All the algorithm files are located at ~/IEdgeInsights/algos/dpm/ folder. Open the dummy_trigger file from ~/IEdgeInsights/algos/dpm/triggers/dummy_trigger.py
gedit ../algos/dpm/triggers/dummy_trigger.py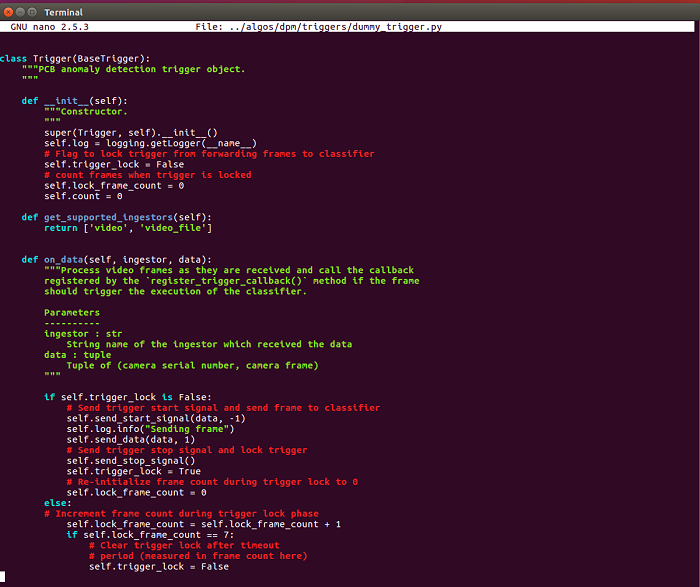
The goal for a trigger is to process the incoming data from the camera and determine whether or not a classification period should be started by Edge Insight. Once a classification cycle is started, it is the triggers job to pass on the incoming video frames to the classification, and then to signal software stack when the classification is finished.
In this file, the algorithm is taking the image from video ingestion container and sending it to data agent to be received by classifier without doing any filtering.
- Open the dummy classifier file at location ~/IEdgeInsights/algos/ dpm/classification/classifiers/dummy.py
gedit ../algos/dpm/classification/classifiers/dummy.py
Classifiers contain the different algorithms to use on the video frames that are ingested into the agent. The “classification” key in the factory.json determines which classifier is used in association with which trigger.
The dummy.py classifier is an empty classifier which will take the image and just return an empty list without any analytics.
You can learn more about the inputs, outputs, and structure of the class in the Developer Guide.
- Build the containers again with the new triggers and classifiers.
 cd ~/IEdfeInsights/docker-setup
sudo ./compose_startup.sh
This should take 2-3 minutes while the video analytics and video ingestion containers are re-built.
- Rebuild the containers using:
cd ~/IEdgeInsights/docker_setup
sudo ./compose_startup.sh
- Then check the log files using:
docker logs -f ia_data_agentThe result shows the dummy trigger and dummy classifier implementation where the trigger passes through every frame, and the empty classifier returns zero defects. You should not see defects listed in the results.