How your application accesses memory can dramatically impact performance. It is not enough to parallelize your application by adding threads and vectorization. Memory bandwidth is just as important but it is often not as well understood by software developers. Tools that help minimize memory latency and increase bandwidth can greatly assist developers with pin-pointing performance bottlenecks and diagnosing their causes.
Today’s modern processors have many different types of memory accesses. For example the latency of an L1 cache hit is vastly different from the latency of an access that misses all of your memory caches and needs to access DRAM. In addition there are also some additional complexities brought about by NUMA architectures.
Intel® VTune™ Amplifier is a performance profiler that now has the many features you can use to analyze memory accesses, these features are contained in the new “Memory Access” analysis type. Using this new analysis type you can:
- Detect performance problems by memory hierarchy (e.g., L1-, L2-, LLC-, DRAM-bound)
- Track memory objects and attribute the latency these objects cause to their appropriate code and data structures.
- Analyze Bandwidth-limited accesses (including DRAM and Intel® QuickPath Interconnect [Intel® QPI] bandwidth) and quickly see graphs and histograms of your DRAM and QPI that show you bandwidth over the timeline of your program.
- Identify NUMA related issues contributing to performance problems
This article will present an overview of the new “Memory Access” feature and will also show several tough memory problems that demonstrate how this feature can be used to greatly increase an applications performance.
Overview
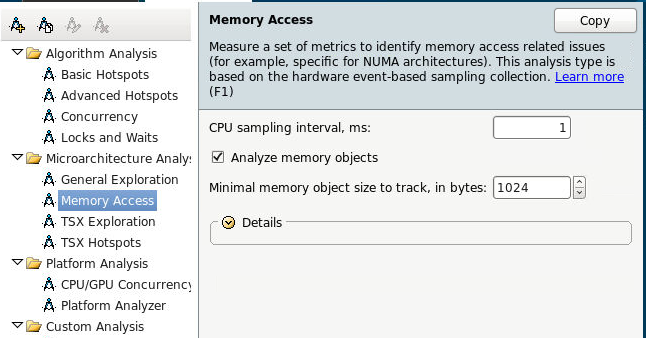
To access VTune Amplifier’s memory access feature, click on the new “Memory Access” analysis type and click start.
View Bandwidth Utilization
You can also see how effective your DRAM and QPI bandwidth is being utilized (Figure 13). You need to be concerned about high bandwidth utilization. To help fix this you can find the places in your code contributing to bandwidth. (Figure 14)
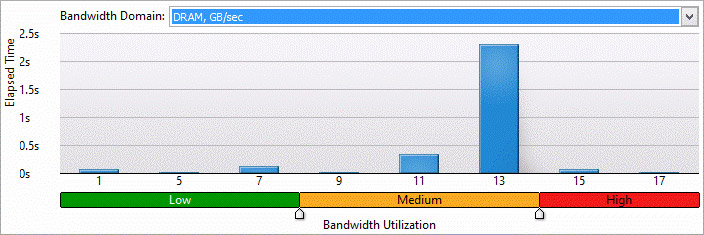
Figure 13. Bandwidth histogram
View Memory Objects Inducing Bandwidth
Identify the code source and memory objects that are inducing bandwidth. Grouping by the Bandwidth Domain allows you to identify memory objects that are contributing most to your memory bandwidth (Figure 14). You can see the sections of code that have more DRAM issues, QPI issues, etc.
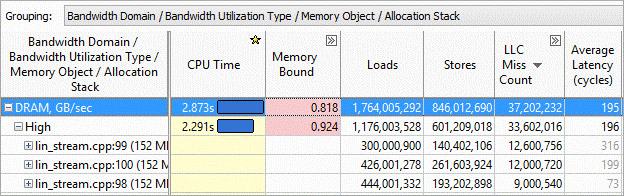
Figure 14. Memory bandwidth
Graph Memory Bandwidth over the Lifetime of Your Application
Your memory bandwidth will generally vary as your program runs. By viewing the bandwidth in a graph that shows your Read/Write Bandwidth in GB/Sec you can see where in your application spikes in memory usage and target the section of your application where the extra memory usage occurs. You can then filter by selecting the area in the timeline where the spike was occurring and see only the code that was active during that time.
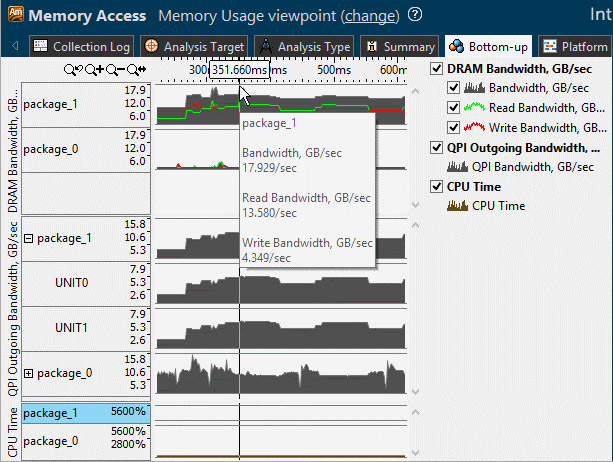
Figure 15. Memory usage
The ability to track down the code sections in your application that are inducing memory bandwidth is a powerful feature. Average Latency is critical when tuning for Memory Accesses. Viewing Bandwidth in the timeline graph is a simple way to characterize your memory usage as your application runs. In the latest version of VTune Amplifier the bandwidth graph is relative to the maximum possible that your platform is capable of achieving so you can clearly see how much performance you are leaving on the table.
Memory Problems Solved Using Intel® VTune™ Amplifier
Tough Problem 1 - False Sharing
First some quick definitions, if more than one thread accesses the same piece of memory than they are said to “share” the memory. Because of the way that modern computers are organized, this sharing can cause all sorts of performance penalties. These performance penalties are necessary because all of the different threads/cores need to agree what is stored at a memory address and synchronizing all of the various caches due to this contention.
False sharing is when two different threads access a piece of memory that is located on the same cache line, they don’t actually share the same piece of memory but because the memory references are located close together they just happen to be stored together on same cache line. When multiple threads have false sharing they have the same type performance penalties that threads that are actually sharing the same piece of memory but they are taking the performance hit that is completely unnecessary.
For this case we’ll study the linear_regression application from the phoenix suite.
Step 1 – Run Memory Access Analysis to Uncover Potential Memory Issues
Run Memory Access analysis with the following options enabled: memory objects analysis, and set object size threshold to 1, to capture all memory allocations.
The Summary view shows some key metrics:
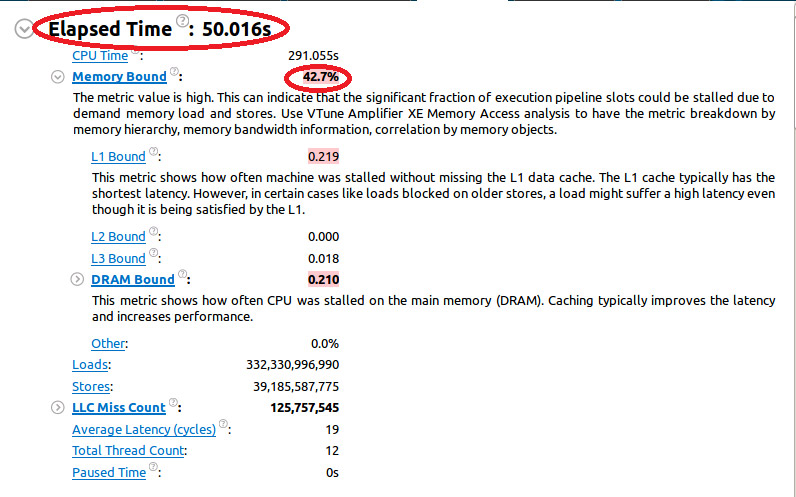
For our first run the “Elapsed time” is 50 seconds. We can also see that the application is “Memory Bound” and that more than 42% of CPU resources are wasted waiting for memory operations to complete.
Note that the “Memory Bound” metric is colored pink, this indicates that a potential performance issue needs to be addressed.
Step 2 – Investigate the Memory Issue Identified
Switch to the Bottom-up tab to see more details:
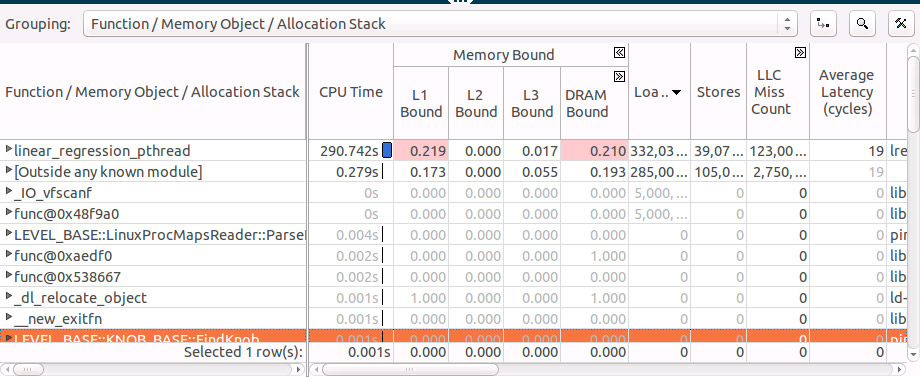
We see that almost all of our time is spent in single function linear_regression_pthread, we can also see that this function is L1 and DRAM bound.
Expand the grid row for the linear_regression_pthread function to see what memory objects it accessed and sort by Loads:
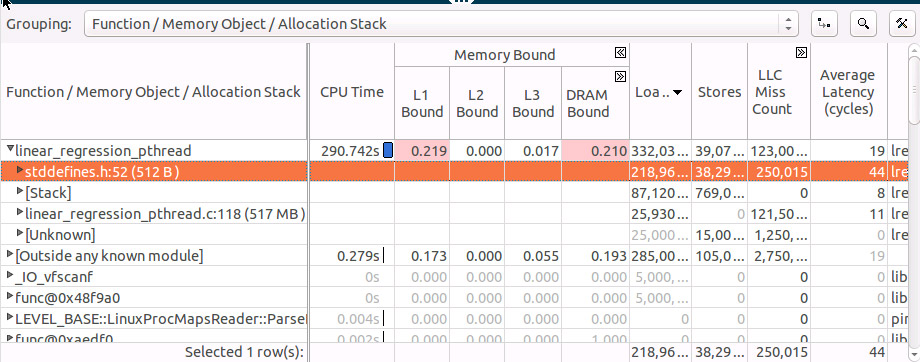
We see that the hottest object (stddefines.h:52 (512B)) is quite small, only 512 bytes, it should fit fully into the L1 cache but the “Average Latency” metric shows a latency of 44 cycles. This far exceed the normal L1 access latency of 4 cycles, this often this means we have some contention issues that could be either true or false sharing. By examining the allocation stack for the ‘stddefines.h:52 (512B)’ object we can see source location where the object was allocated. We can see that each thread is independently accessing it’s element in the array so it does look like false sharing!
Step 3 – Modify the Code to Remove the False Sharing
False sharing can typically be easily avoided be adding padding so that threads always access different cache lines.
Step 4 – Rerun Memory Access Analysis
Here is the new result:

The new Elapsed Time is now 12 seconds, we improved the application’s performance by approximately 4 times just by making a one line code change that padded a structure. The “Memory Bound” metric is also much lower and the “L1 Bound” issue has been resolved.
Tough Problem 2 – NUMA Issues
In a processor that supports Non-Uniform Memory Access (NUMA), it is not enough to know that you missed a cache on the CPU where you are running. In NUMA architectures you could also be referencing the cache and DRAM on another CPU. The latencies for this type of access are an order of magnitude greater than the local case. You need the ability to identify and optimize these remote memory accesses.
For this case we’ll study a simple triad application parallelized using OpenMP* and running a dual-socket Haswell-based Xeon.
Here is the code:
static double a[N];
static double b[N];
static double c[N];

void doTriad(double x)
{
#pragma omp parallel for
    for (int i = 0; i < N; i++)
        a[i] = b[i] + x*c[i];
}
int main() {

    for (int i = 0; i < N; i++)
    {
        a[i] = 1.0;
        b[i] = 2.0;
        c[i] = 0.0;
    }

    for (int n = 0; n < NTIMES; ++n)
    {
        doTriad(3.0);
    }

    return 0;
}
First we initialize the arrays and then call the triad function that uses a omp parallel for.
Step 1 – Run Memory Access Analysis
Run the Memory Access analysis on this application. The expectation is for it to be DRAM bandwidth bound, it should utilize the system bandwidth up to the maximum.
In the summary section there are some very useful metrics. We can see the elapsed time is 12.449 seconds. The “Memory Bound” metric is high and highlighted as we expected. What is puzzling is the “Bandwidth Utilization” Histogram shows only a medium DRAM bandwidth utilization level, around 50 – 60 GB/s, this will need to be investigated.
Some of other useful metrics are:
- Average Latency – The average number of cycles our memory accesses are taking. Note: a L1 memory access can usually be done in 4 cycle buta remote DRAM access can take~300 cycles.
- KNL Bandwidth Estimate – This is an estimate of the expected per core bandwidth if run on Intel’s new of Intel Xeon Phi platform (code named Knights Landing) . This is very useful for users who will be moving to KNL and would like to know if the memory access portion of their code is ready.
Step 2 – Investigate Bandwidth Utilization
Switch to Bottom-up tab to see more details:
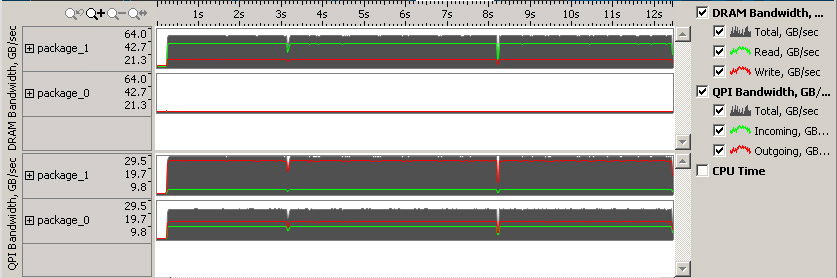
From the timeline graph we see that DRAM bandwidth is utilized on only one of the sockets, package_1. In addition we see high QPI (intra-socket) traffic, up to 30 GB/s. This is one of the typical issues on NUMA machines where memory is allocated on one node and the work is split between multiple nodes, this forces some of them to have to load the data remotely over QPI links, this is much slower than accessing local memory.
Step 3 – Modify the Code to Avoid Remote Memory Access
If we change the code to make both sockets access only local memory, thus avoiding remote node accesses, it should let us run faster. On Linux memory pages are allocated on first access so the solution for our case is simple, we should initialize the memory on the same nodes where we’ll be working with them. We can accomplish by adding a “omp parallel for” pragma to our initialization loop.
Step 4 – Re-run Memory Analysis with KMP_AFFINITY Variable
Our Elapsed Time has decreased from 12.449 to 6.69 seconds, this is almost a 2x speed-up. Also, our “DRAM bandwidth” utilization moved to high levels, aligned with expectations.
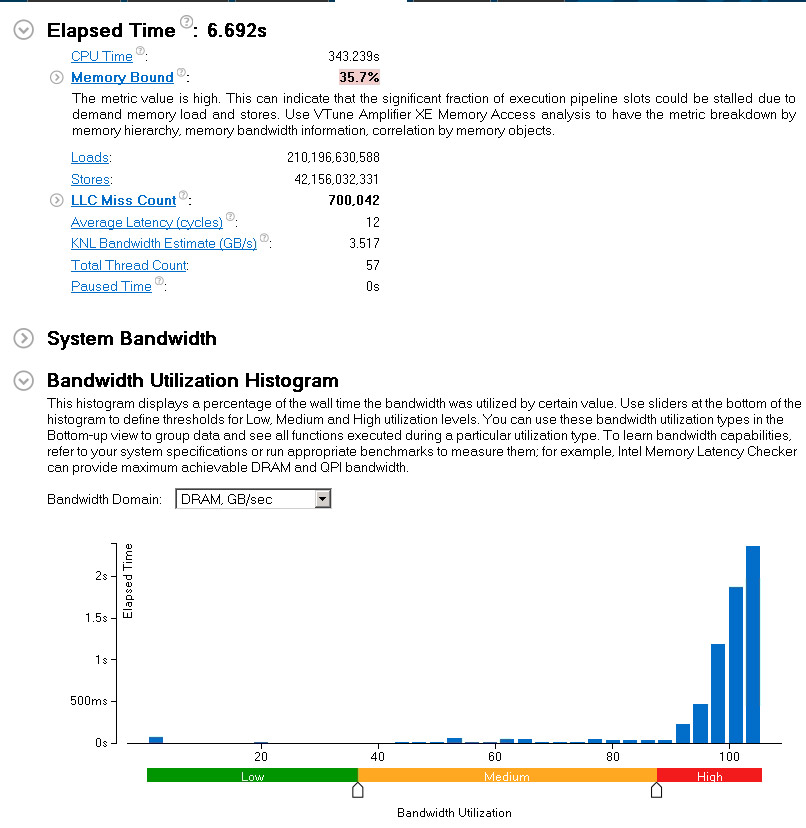
Bandwidth is now equally split between the sockets and QPI traffic is 3x lower.
The complexities of NUMA architectures necessitate greater attention to the details of your memory accesses. By optimizing the memory accesses in your application that have the greatest latencies you can get the biggest potential performance gains.
Conclusion
It is critical to optimize the memory accesses of your program. Understanding how your program is accessing by using a tool such as Intel VTune Amplifier can greatly assist you in getting the most out of your hardware.
We showed an overview of the new Intel VTune Amplifier memory access analysis feature. We also showed some tough memory problems could be resolved by using this feature.
We showed how users could detect false sharing problems by seeing high average latency values for relatively small memory objects. We improved application performance by 4x with a trivial 1-line code change by just padding a structure
We also showed how users could help detect NUMA issues with significant amount of remote memory accesses. We improved application performance by 2x after removing the remote access.
"