Introduction
Intel® Graphics Performance Analyzers (GPA) offers a wide range of tools to analyze graphics applications across diverse workloads, platforms,, and graphics APIs. Within Intel® GPA you can use Graphics Trace Analyzer to explore where you can distribute workloads evenly across CPUs and GPUs. This article will dive deep into fundamental trace capture capabilities that can be configured in Graphics Monitor to aid in the future analysis of trace files in Graphics Trace Analyzer. Topics covered in this article can be visualized in video format in the Capture and Configured Trace Deep Dive video, by checking reference markers in the images associated with this article.
Pre-requisites
Before proceeding with this article, ensure you have the minimum system requirements to successfully analyze graphics applications using Intel® GPA. Also make sure you have downloaded and installed Intel® GPA on your host platform.
Configuring Trace
To begin configuring trace capture capabilities, open Graphics Monitor, then click on the options button on the bottom right hand side of the tool to open the settings menu. Once in the settings menu, select the trace tab to view the options that you can utilize while capturing a trace in Graphics Monitor.
Trace Collection Settings
The trace duration option allows you to select the duration of the application to be captured into a ring buffer, holding only the most recent events within the defined duration. The default value for this option is five seconds, but this value can be altered to best suit your use case.
Toggling on the capture application startup setting enables trace captures to be started automatically at the start of an application and end when the trace buffer is full.
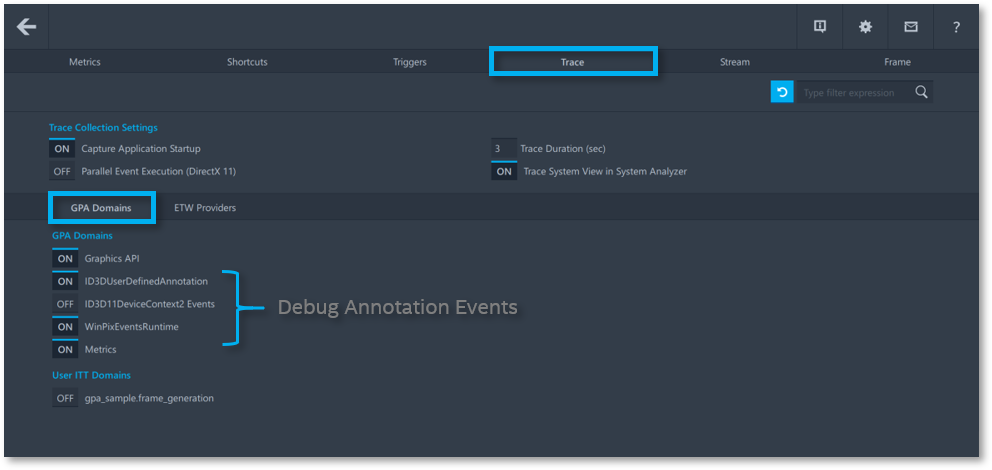
GPA Domains Tab
Toggling on the metrics option under the GPA domains tab enables performance-based metrics for your trace captures, allowing you to analyze a variety of metrics based on your host systems hardware.
There are several options under this tab that enable the capturing of debug annotation events generated by different providers and you should select the most appropriate option for your target application. If you are unsure which ones apply then it is recommended that you maintain the default setting in the GPA Domains tab, since enabling all of them may cause duplicated regions to be captured in a trace file.
In addition to these options, the instrumentation and tracing technology API provided by Graphics Monitor, allows your application to generate and control the collection of trace data during the applications execution. You can add custom ITT instrumentation to the application enclosed with your own domains and when the application starts those domains are registered with Graphics Monitor and can be toggled on and off accordingly.
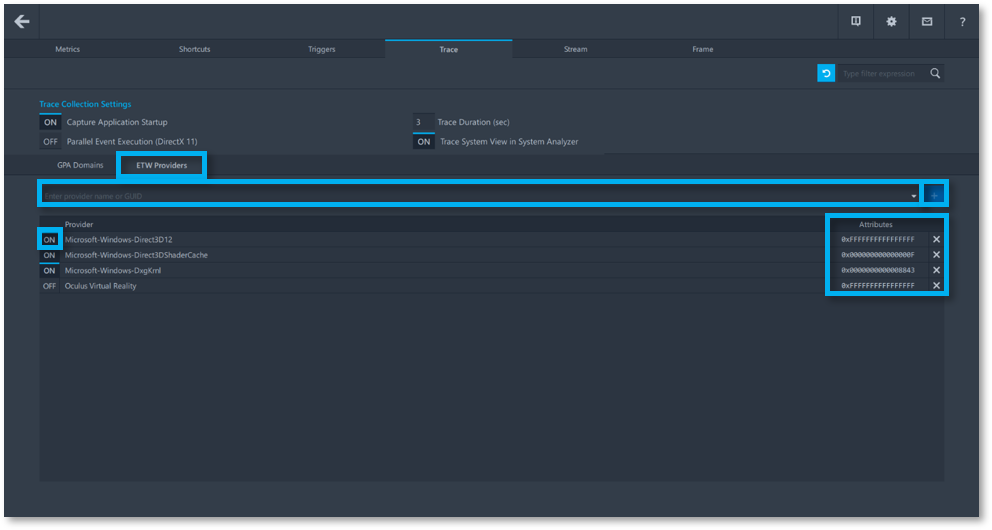
ETW Providers Tab
Clicking on the ETW providers tab in the trace settings of Graphics Monitor will allow you to enable event tracing from specific providers on Microsoft* Windows machines. You can search for an ETW provider by either typing the provider name in the enter provider name or GUID bar, or by clicking on that bar and selecting an ETW provider from the drop-down menu. Once your provider has been selected you can press either the plus (+) button to the right of the enter provider name or GUID bar or press the enter key on your keyboard to add that provider to your ETW provider list. If you want to enable or disable an ETW provider in your provider list, simply press the toggle button next to the providers name to toggle it on or off accordingly.
When enabling an ETW provider you can edit the attributes field, which contains a masked value that specifies the group of events to capture in your trace. The default value assumes that all events are enabled but modifying this value will alter the scope of the captured events, allowing you to target events to your specific use case.
NOTE: You can create your own ETW provider and register it to Graphics Monitor by using a system command line tool.
Capturing Trace
Once your trace settings have been adjusted to your liking you can exit out of the settings menu by pressing the left arrow button to the top left-hand side of the settings menu. To enable trace captures, select the trace option from the drop-down menu next to the start button. To select your application for capture either press the triple dot (…) button next to the Application Executable with Command line arguments bar then select your applications executable or enter the path to your applications executable in that bar and the path to your applications working directory in the bar just below it.
Once both your applications executable and working directory paths have been defined you can press the start button to launch your application. With your application actively open you can use the trace capture key-binding to capture a trace at any desired point while running your application. The default key-binding to capture a trace is CTRL-SHIFT-T on your keyboard, but this can be altered in the settings of Graphics Monitor and then in the shortcuts tab.
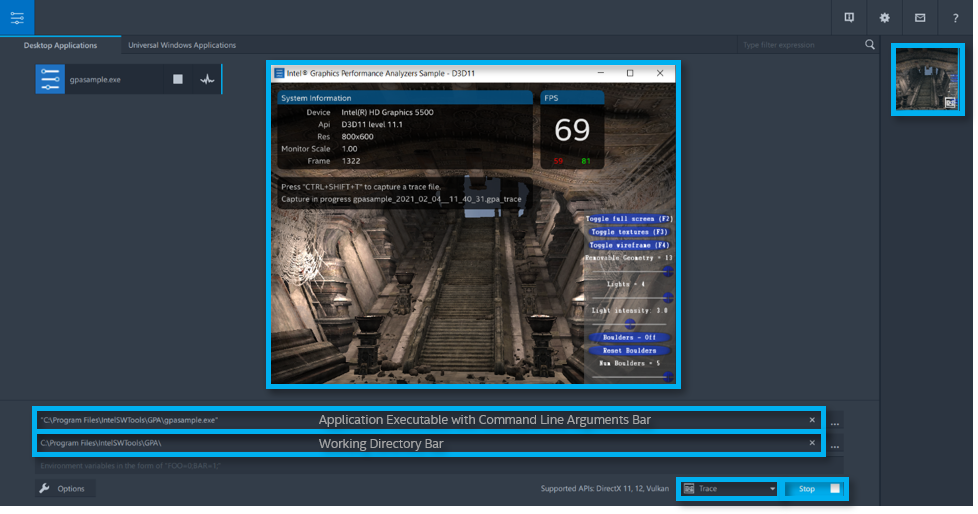
You can close out of your application then double click on the newly created trace file to the right-hand side of Graphics Monitor to open the file in Graphics Trace Analyzer for further analysis. You can also open trace files directly in Graphics Trace Analyzer by opening the tool, selecting the trace you want to analyze further and then press the Open button.
Conclusion
This article demonstrated how to configure and capture a trace in Graphics Monitor to tailor your trace captures to your specific use case. For more information on how to identify and analyze problem areas in your applications to distribute workloads evenly across CPUs and GPUs continue reading the Graphics Trace Analyzer Deep Dive articles.
Additional Resources
Part 1: Configure and Capture Trace (Video)
"